Google Analytics Mobile App Metrics (Acquisition & Retention) Dashboard Template
Template Created By  Japio
Japio
Use Japio's Google Analytics Mobile App Metrics (Acquisition and retention ) dashboard template for free. Measure user retention and engagement, the number of daily new signups, revenue, your app’s most frequently used features, and more.
What all you can learn from Japio's Google Analytics Mobile App Metrics (Acquisition and retention) Dashboard Template
Use Japio’s Google Analytics Mobile app metrics (Acquisition and retention) Dashboard Template, to learn about your application’s features, the behaviour of users, and more. And most importantly, you can learn everything about your application’s acquisition and retention. Also, learn:
- What are some common behaviors of your app users ?
With Japio’s Google Analytics Mobile app metrics (Acquisition and retention) dashboard templates you can find the key activities and behaviours of users. By this, you can determine if your app users are likely to return and complete a goal.
- Where are your app users located?
Take a look at all of the countries your app users are in and get a better understanding of which regions are driving traffic and usage.
- Find whether your user onboarding process is effective or not?
Measure how efficiently your onboarding process is converting downloads into highly engaged paying users.
- What is your average screen view by session?
Measure the total number of application screens that users interact with on average during the session and understand their participation.
- Which screens do users of your app interact with most often?
Understand how much revenue your business generates from each visitor who interacts with your website’s specific screen over a period of time.
- How many new users does your app generate every day?
Track your daily subscriptions (signups) to the app and compare daily, weekly, and monthly results to ensure that your subscribers and income continue to increase.
- NEW USERS
Number of first-time users in a given time period
- AVG. TIME ON SCREEN
Average time users viewed a given screen or screen group in a given time period
- % NEW SESSIONS
Percentage of sessions created by new users (first visits) in a given time period
- SCREEN VIEW BY SCREEN NAME
Number of screens displayed Repeated viewing of a single screen is counted within a specific date range, separated by the screen name
- SCREENS / SESSION
The average number of screens viewed per session over a time period. Separate statistics for each viewing of the same screen, including repeated viewing of the same screen.
- SESSIONS BY GEO LOCATION
The number of sessions in the specified date range divided by the geographic location.
- USERS
Users who have logged in at least one session within the specified date range.
- SESSIONS
The number of sessions in a period of time. A session refers to the time period during which users actively interact with your website, application, and more.
Get a deeper understanding and additional data by using our integration with google analytics
You can use Japio’s Google Analytics integration to track and analyze the following:
- SEO results.
- Engagement in social media platforms.
- Generation of leads.
- Lead demographics and traffic.
- Performance of campaigns by custom events.
- Paid Advertisement.
- Performance of landing pages.
Get many more alternative metrics and data by using Google Analytics Mobile App Metrics (Acquisition and retention) dashboard templates. In Japio, we provide many varieties of dashboard templates.
More 1-Click Dashboard Template
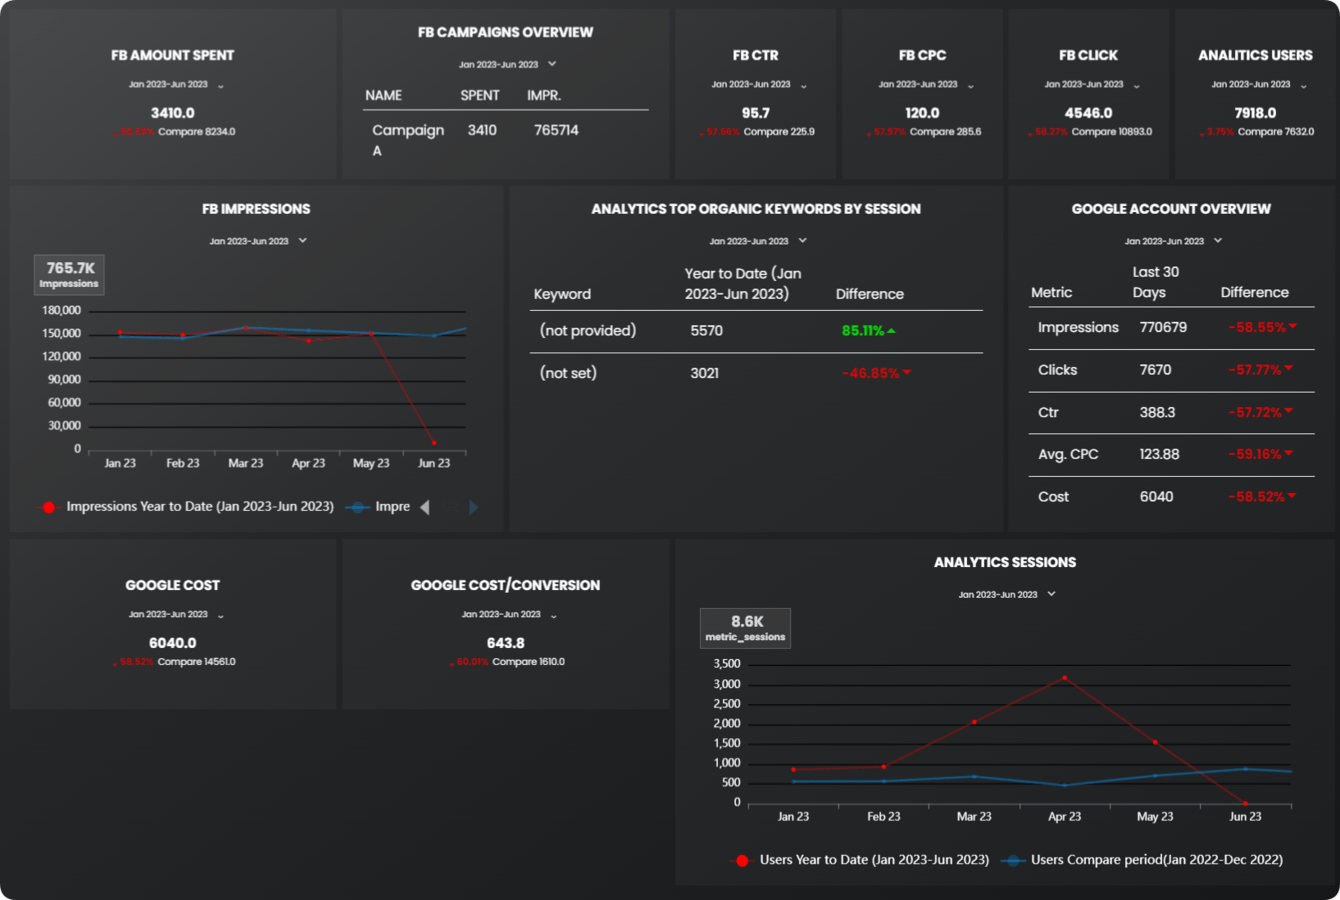
Facebook and Google ads paid marketing overview dashboard template
Manage the ROI and the performance of your paid campaigns on a single platform with the Facebook and Google ads paid marketing overview dashboard template.
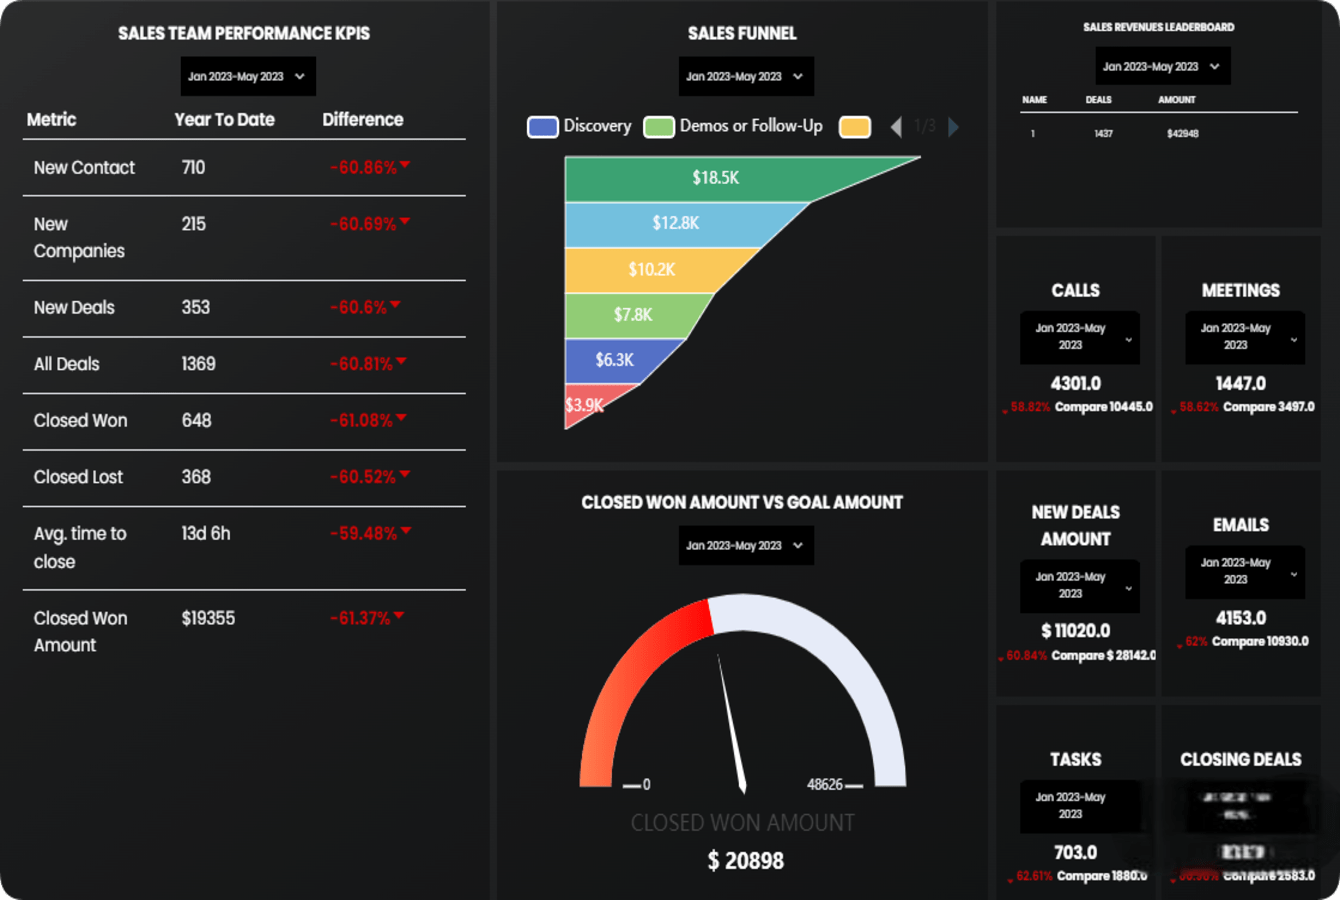
HubSpot CRM Sales Dashboard Template
A report with visuals showcasing monthly performance by the sales team.
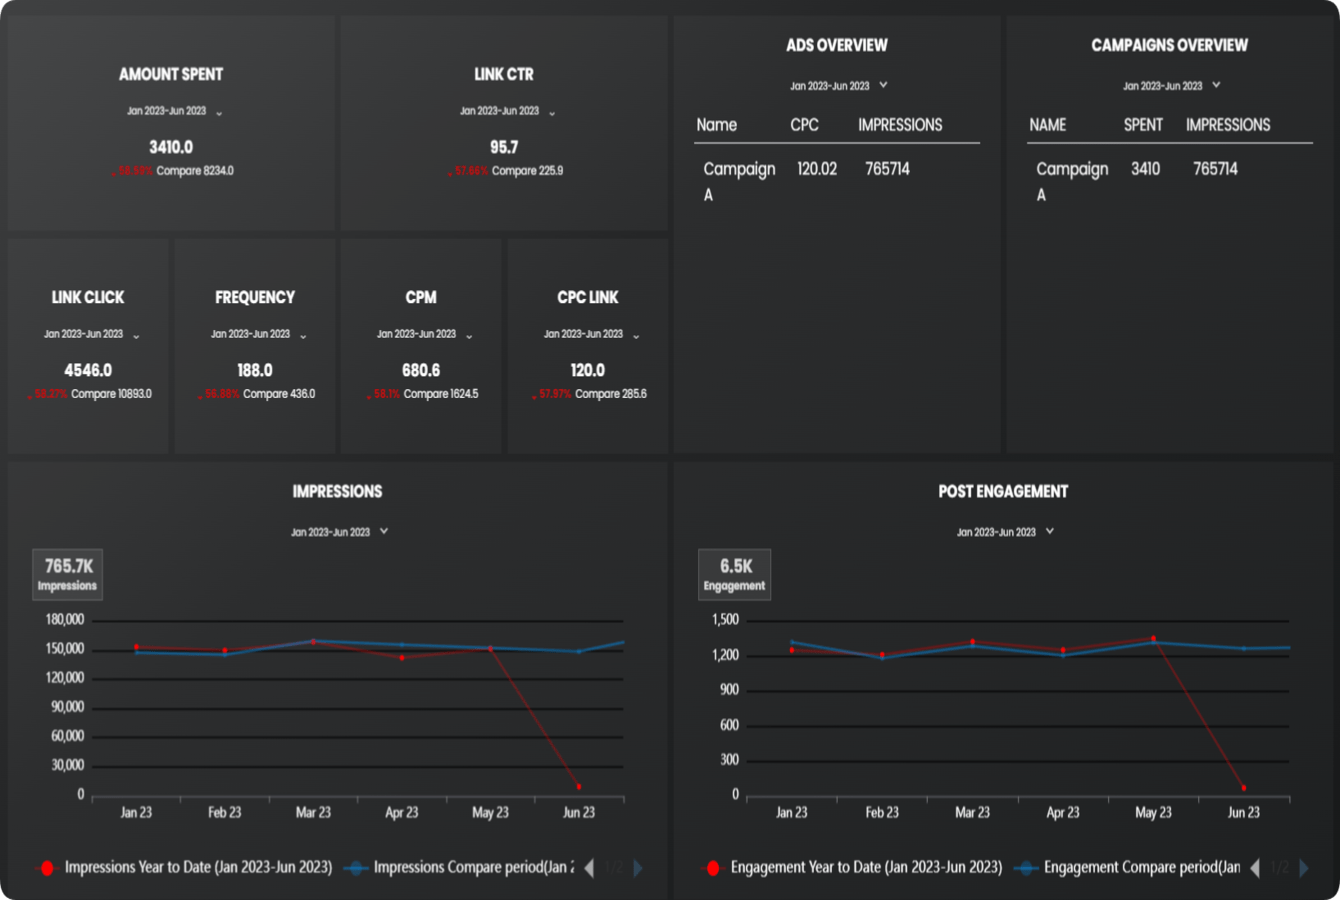
Facebook Ads campaign performance dashboard template
With the Facebook Ads dashboard template check the engagement of your ad campaigns, money spent, click activity and so much more.
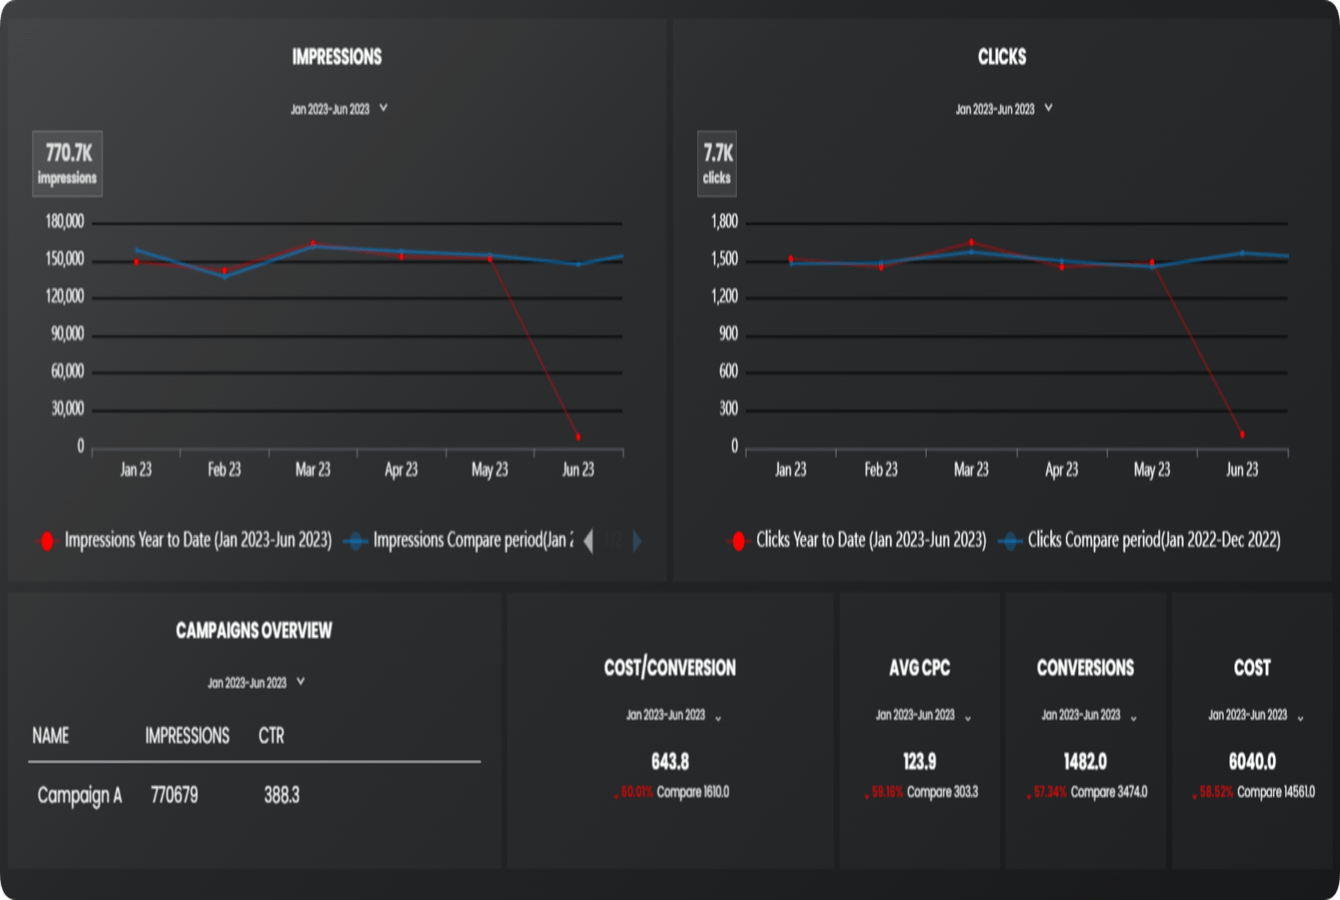
Google Ads dashboard template
Track the Google ad campaigns and important metrics like cost per conversion, impressions, conversion rate, etc. with a customizable, efficient and simple Google ads dashboard template. Enhance your campaign performance by analyzing the data.
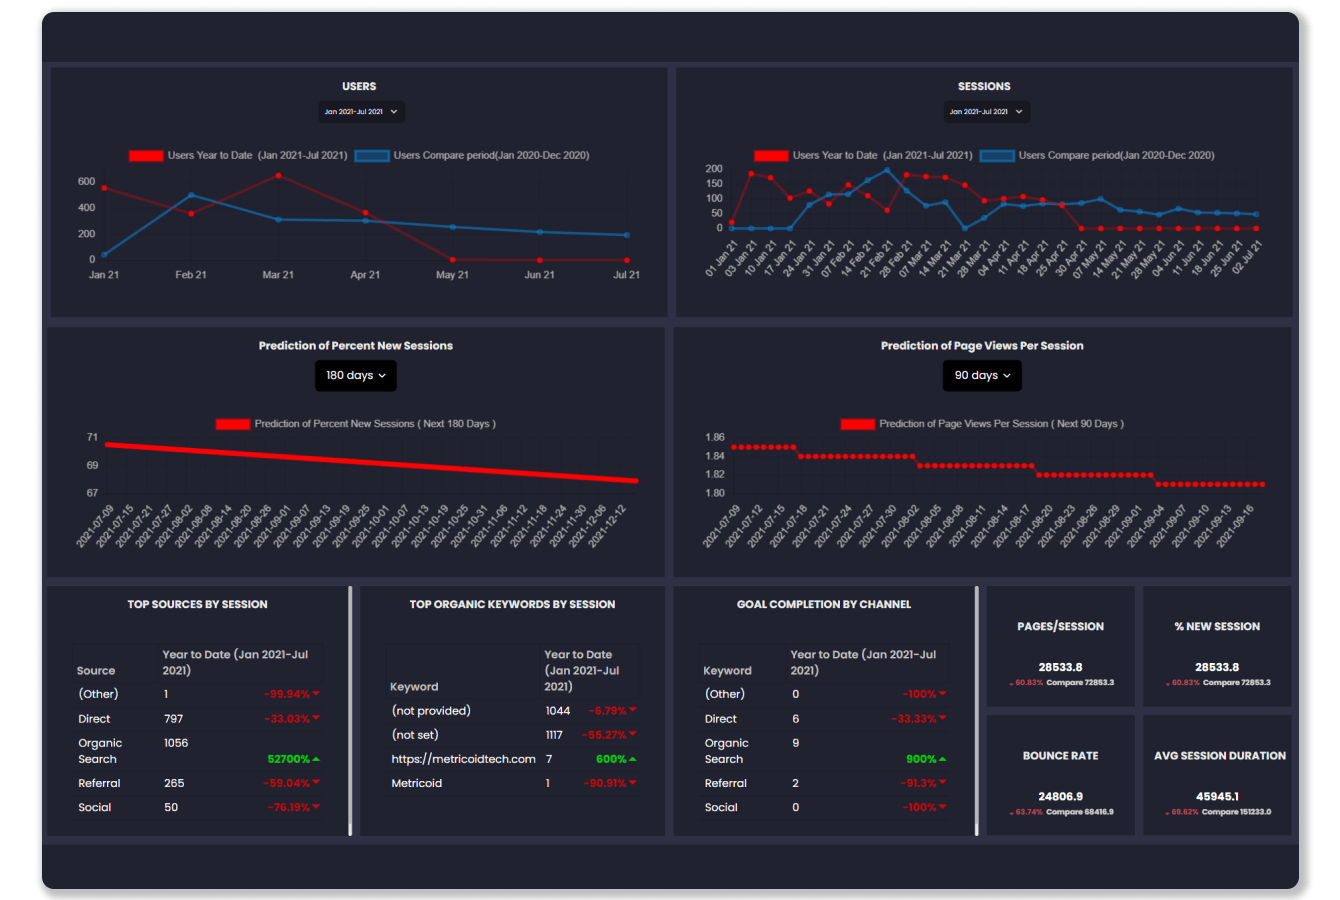
Google Analytics (Website traffic)
Google Analytics dashboard template which will give you insights about your users, sessions, referrals and more.
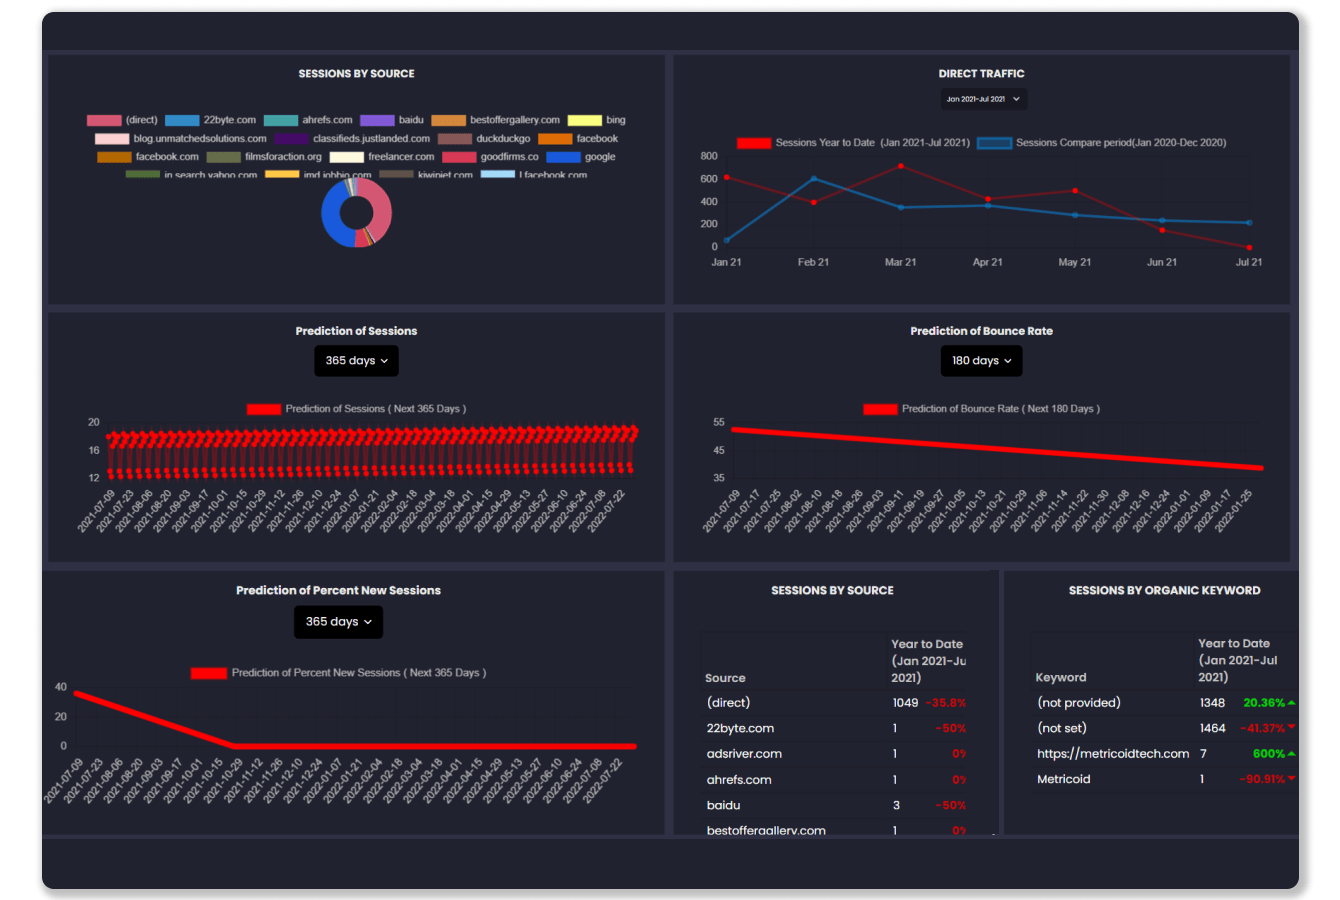
Google Analytics (Acquisition Snapshot)
Google Analytics dashboard template which will give you insights about your users, sessions, referrals and more.
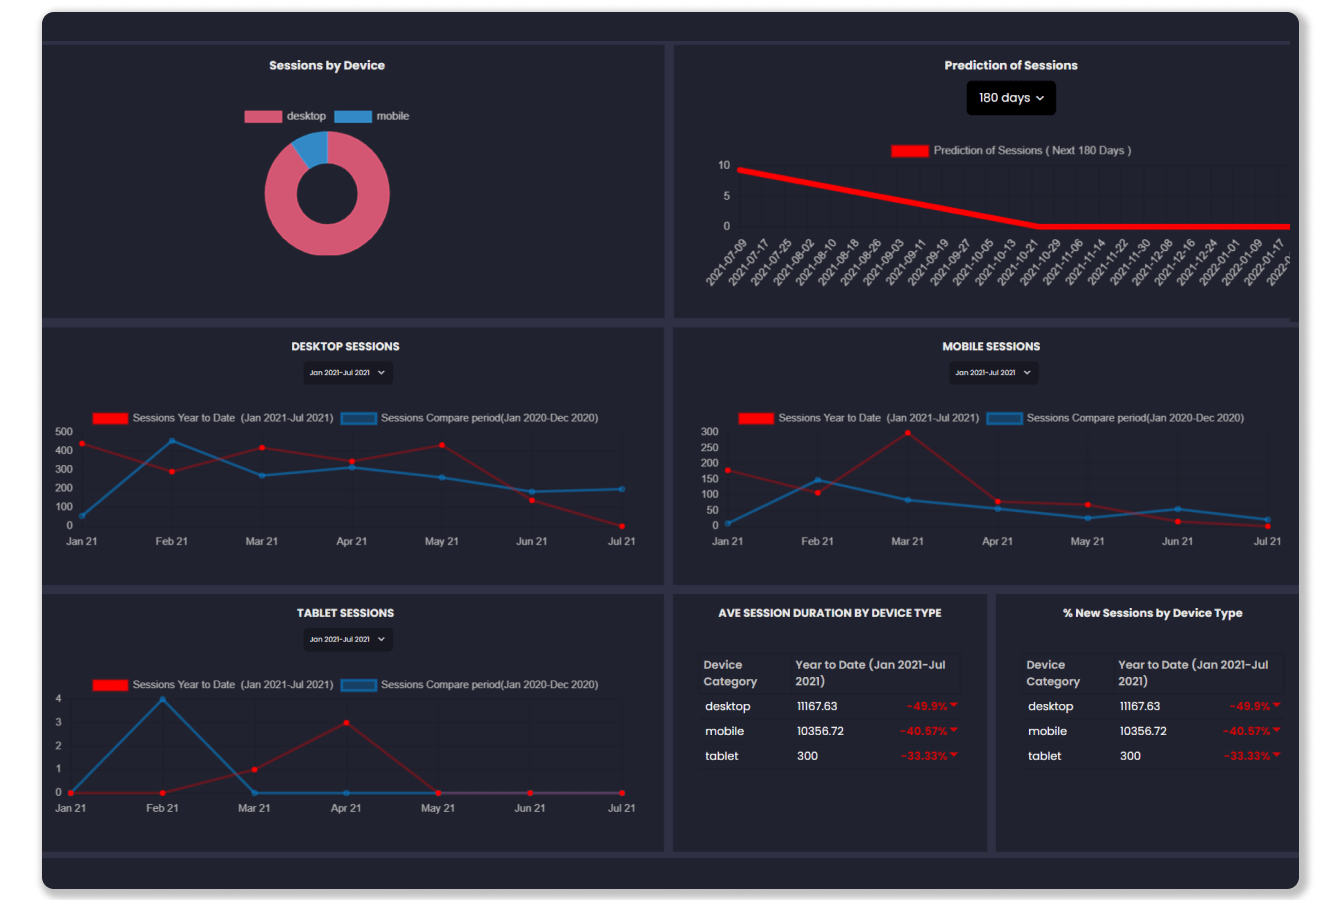
Mobile vs Desktop Traffic
Use this free dashboard template to optimize your website’s user experience for both mobile and desktop.
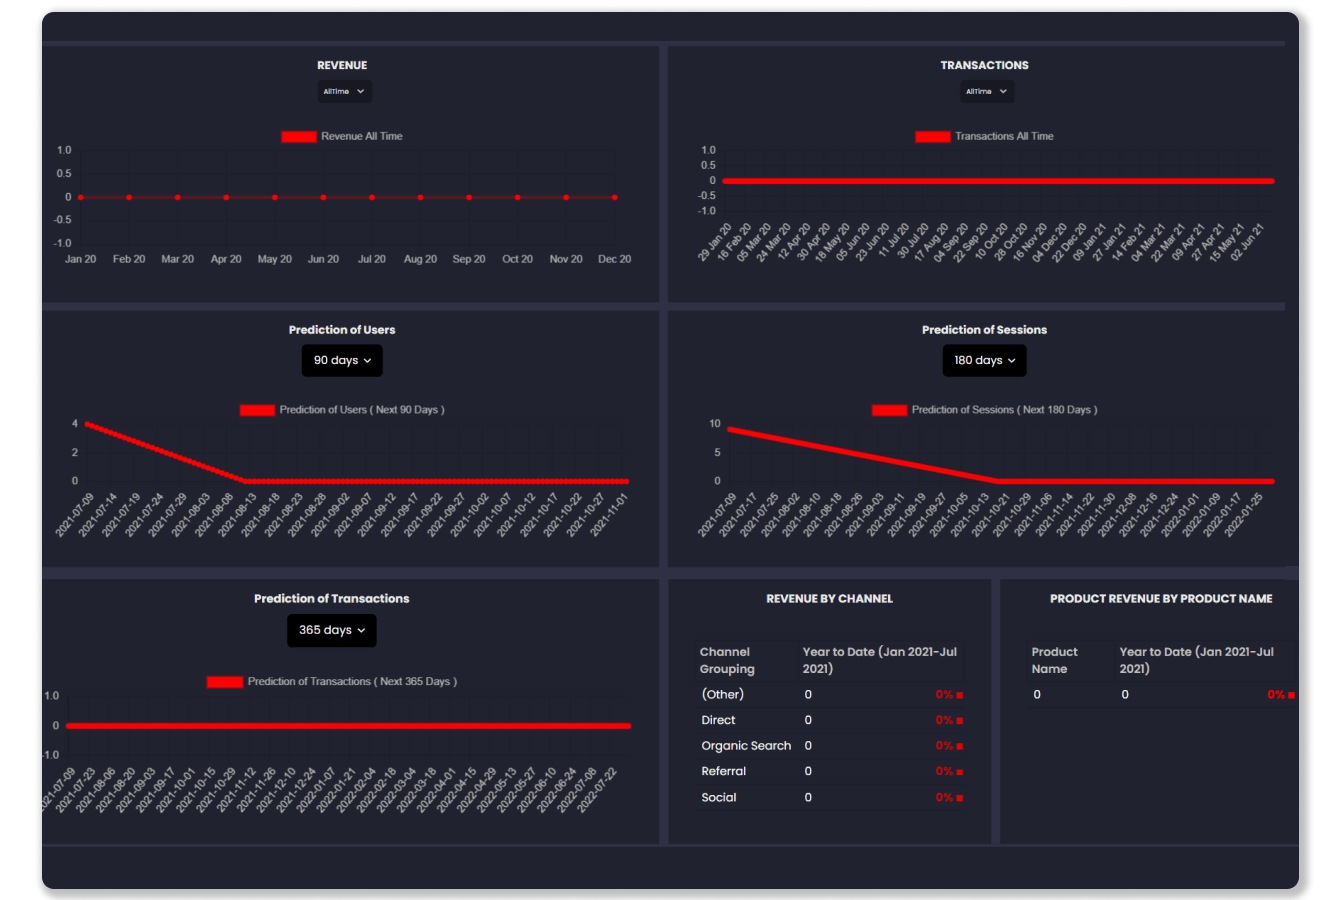
Google Analytics (Ecommerce overview)
Google Analytics dashboard template which will give you insights about your Transactions and Revenue, conversion rates and more.
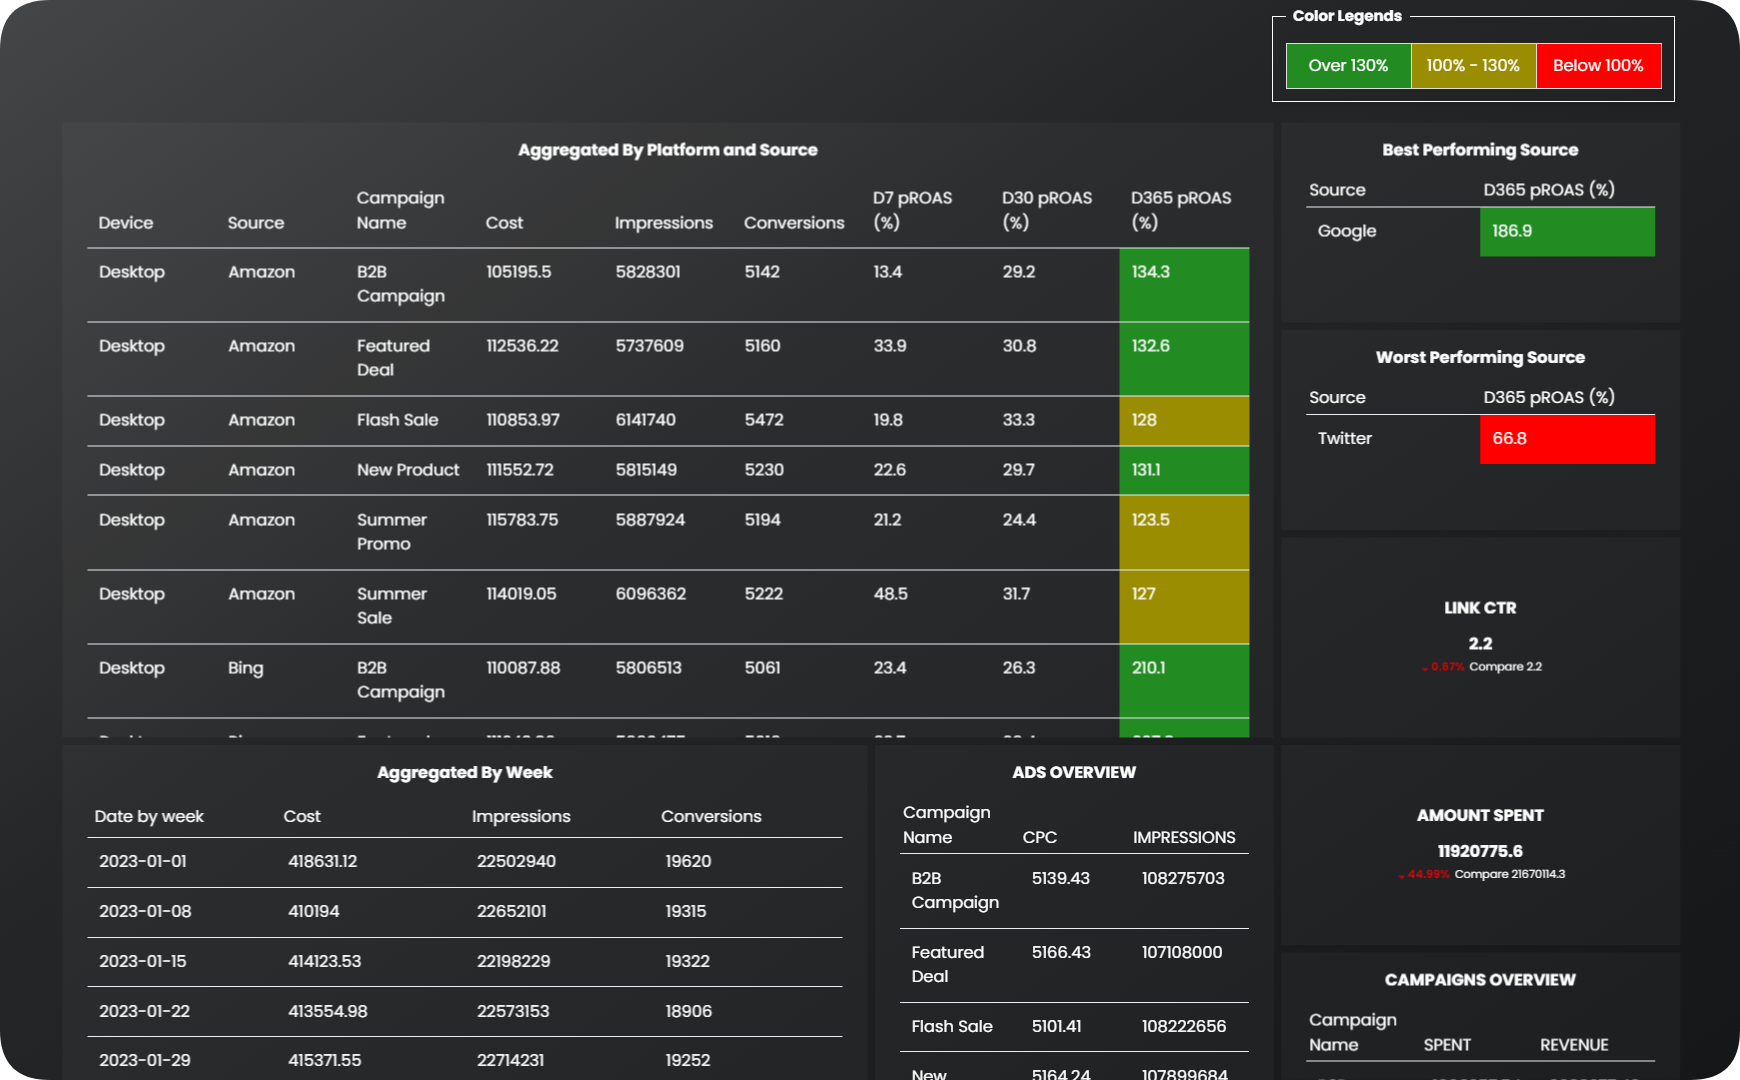
Campaign Management Dashboard Template
Optimize Campaign Success with Predictive ROAS , Your All-in-One Marketing Campaign Management Dashboard
