Google Analytics (Ecommerce overview) Dashboard Template
Template Created By  Japio
Japio
Using Japio's Google Analytics (Ecommerce Overview) dashboard template get full insights into Your eCommerce store. Learn about revenue, transactions, conversion rates and more.
What all you can learn from Japio's Google Analytics (Ecommerce overview) Dashboard Template
Connect to Google Analytics account and learn:
- How to track the number of transactions in the online store?
Track and analyze e-commerce transaction data, that is, the number of orders placed on your website today, this week, etc. Track daily fluctuations in the number of transactions recorded and compare them with the same day in the previous month.
- How many sales did you generate?
Real-time view of the revenue generated from website sales this month. Analyze daily trends to ensure that your e-commerce website generates enough revenue to achieve your sales goals.
- How to check the number of visits to your e-commerce website?
Track and measure the number of new and returning visitors to your website and the number of unique sessions initiated by these users.
- Are visitors to your e-commerce website converting?
Find out what percentage of your website visits lead to recommendations. This is a good way to evaluate whether your website needs to be optimized to increase conversion rates.
- How to measure the revenue your website generates for each visitor?
Understand how much revenue your business generates from each visitor who interacts with your e-commerce site over a period of time.
- How much do customers spend on your website on average?
View and Track the average amount each customer spends on each transaction on your e-commerce website.
- How to define your best-selling products?
Find the most popular products based on the number and sales of the month.
- REVENUE
Revenue from online transactions or in-app transactions during a specified period. Depending on your implementation, this may include taxes and shipping costs.
- AVG. ORDER VALUE
The average number of transactions in the specified period (date range).
- ECOMMERCE CONVERSION RATE
The percentage of sessions that ended in e-commerce transactions within the specified time period (date range).
- PRODUCT REVENUE BY PRODUCT NAME
The revenue from the sale of a single product during the specified period divided by the product name.
- REVENUE BY CHANNEL
Revenue from e-commerce or in-app transactions during the specified time period, divided by the channel.
- REVENUE PER VISIT
The money that is generated when customers visit your website within a certain period of time (date range).
- USERS
Users who have logged into at least one session within the specified date range.
- TRANSACTIONS
The number of purchases made on your website during the specified time period.
- SESSIONS
The total number of sessions in a given period. A session refers to the amount of time that users are actively interacting with your website, application, and so on.
Get a deeper understanding and additional data by using our integration with google analytics
You can use Japio’s Google Analytics integration to track and analyze the following:
- Conversions and traffic of a website.
- Lead demographics and Traffic.
- Engagement in social media platforms.
- Paid Advertisement.
- Performance of campaigns by custom events.
- Performance of landing pages.
Get many more alternative metrics and data by using Google Analytics (Ecommerce overview) Dashboard Template. In Japio, we provide many varieties of dashboard templates.
More 1-Click Dashboard Template
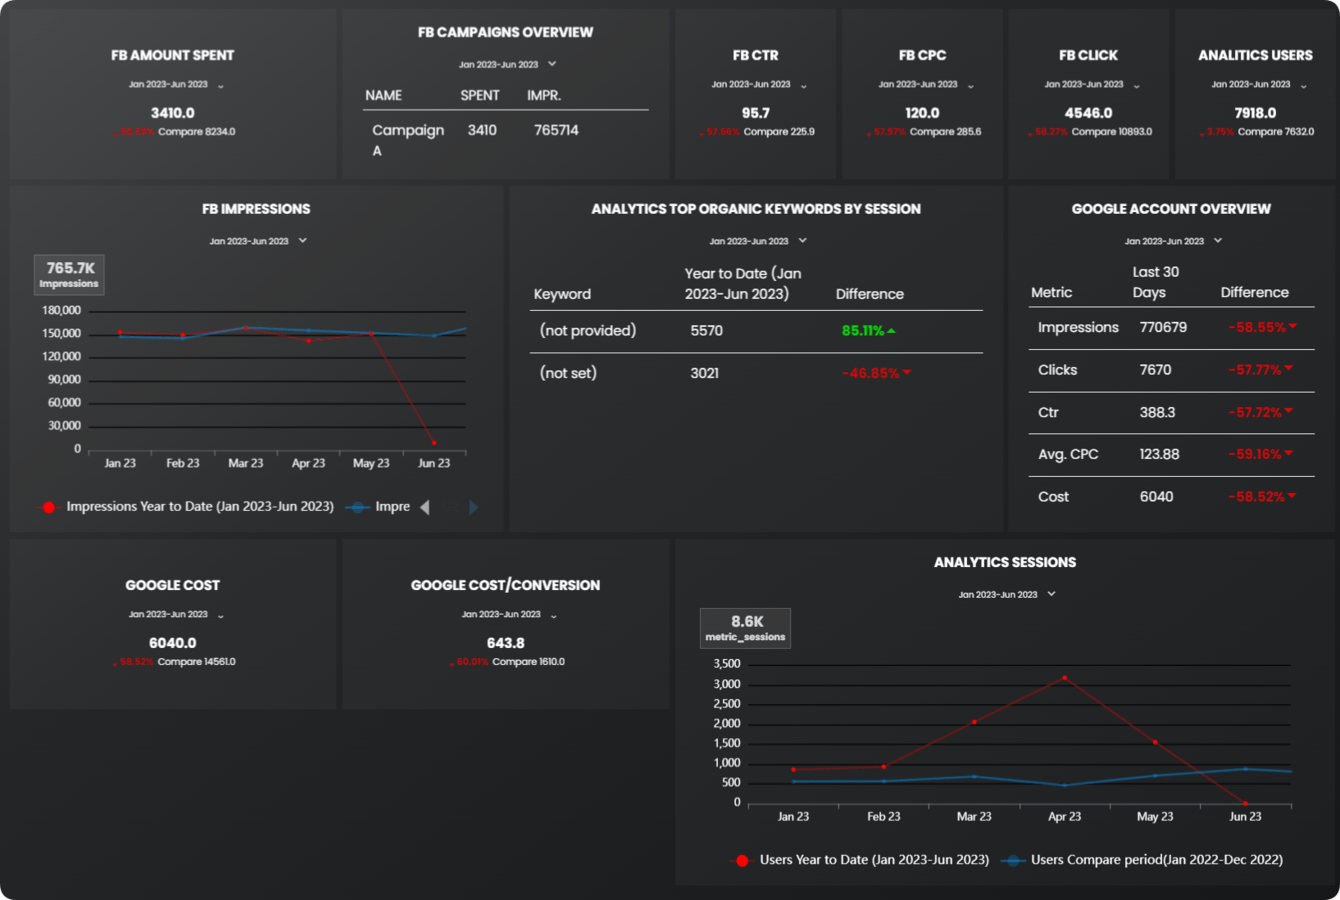
Facebook and Google ads paid marketing overview dashboard template
Manage the ROI and the performance of your paid campaigns on a single platform with the Facebook and Google ads paid marketing overview dashboard template.
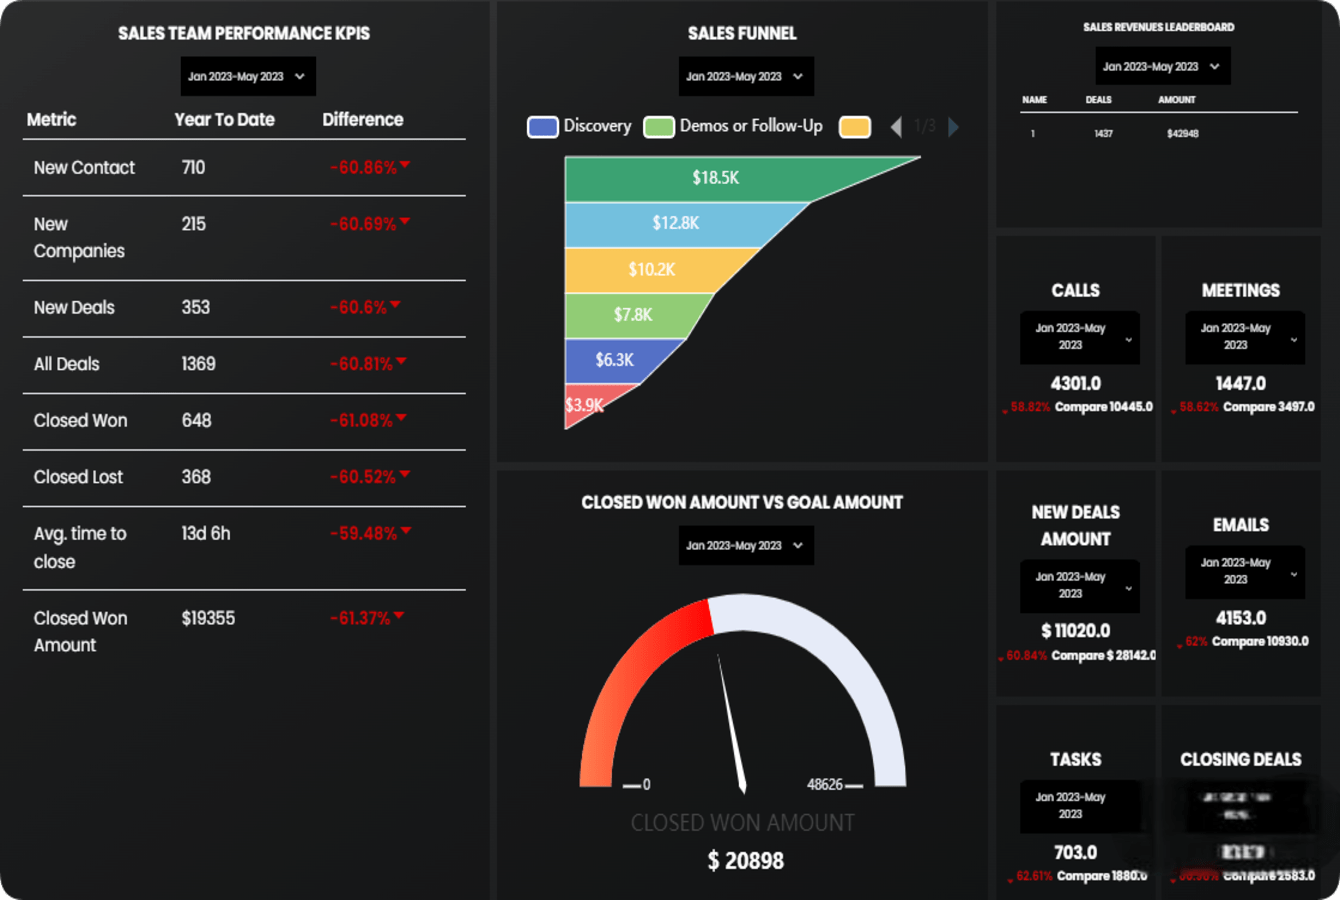
HubSpot CRM Sales Dashboard Template
A report with visuals showcasing monthly performance by the sales team.
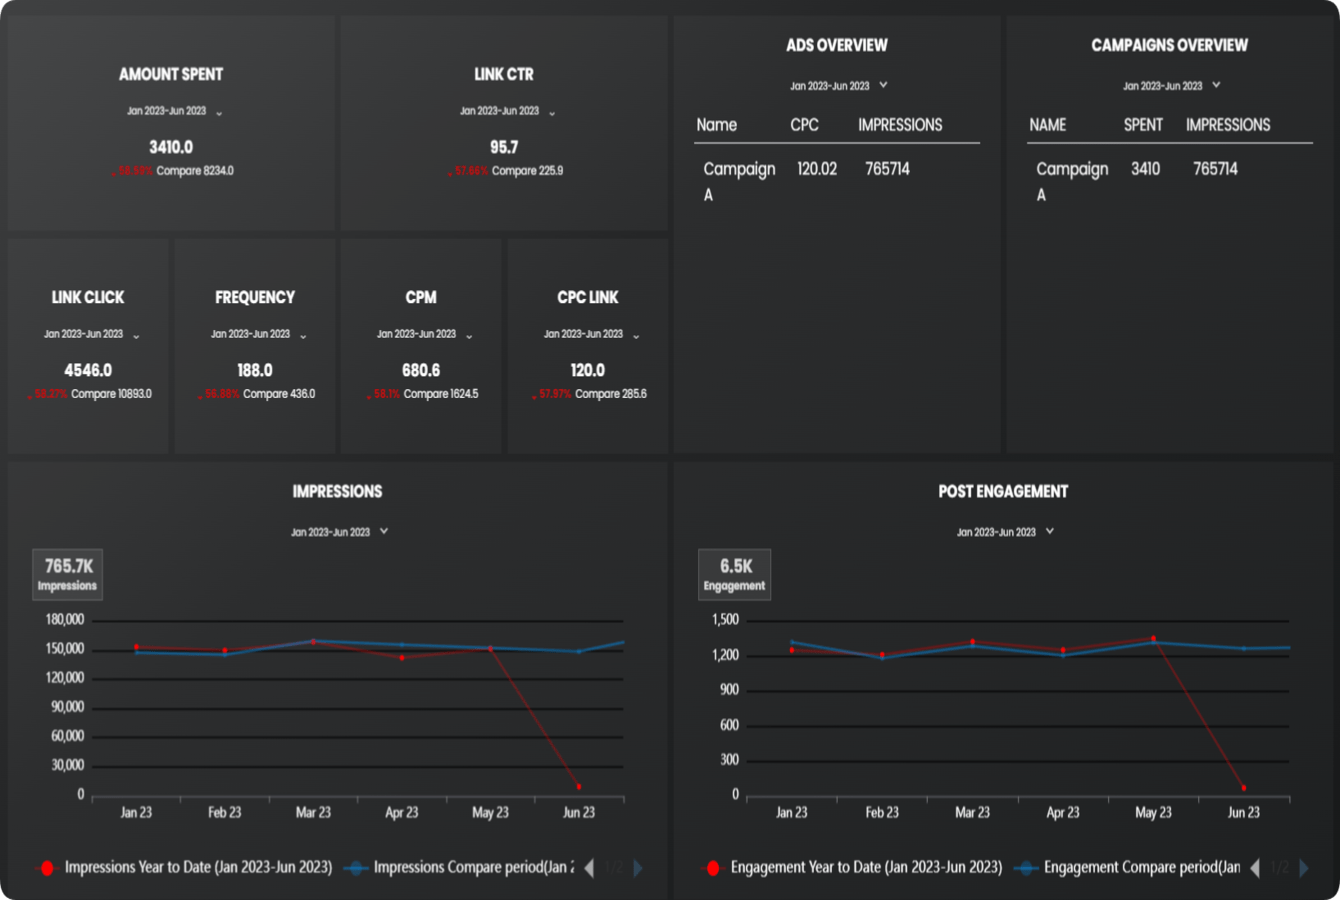
Facebook Ads campaign performance dashboard template
With the Facebook Ads dashboard template check the engagement of your ad campaigns, money spent, click activity and so much more.
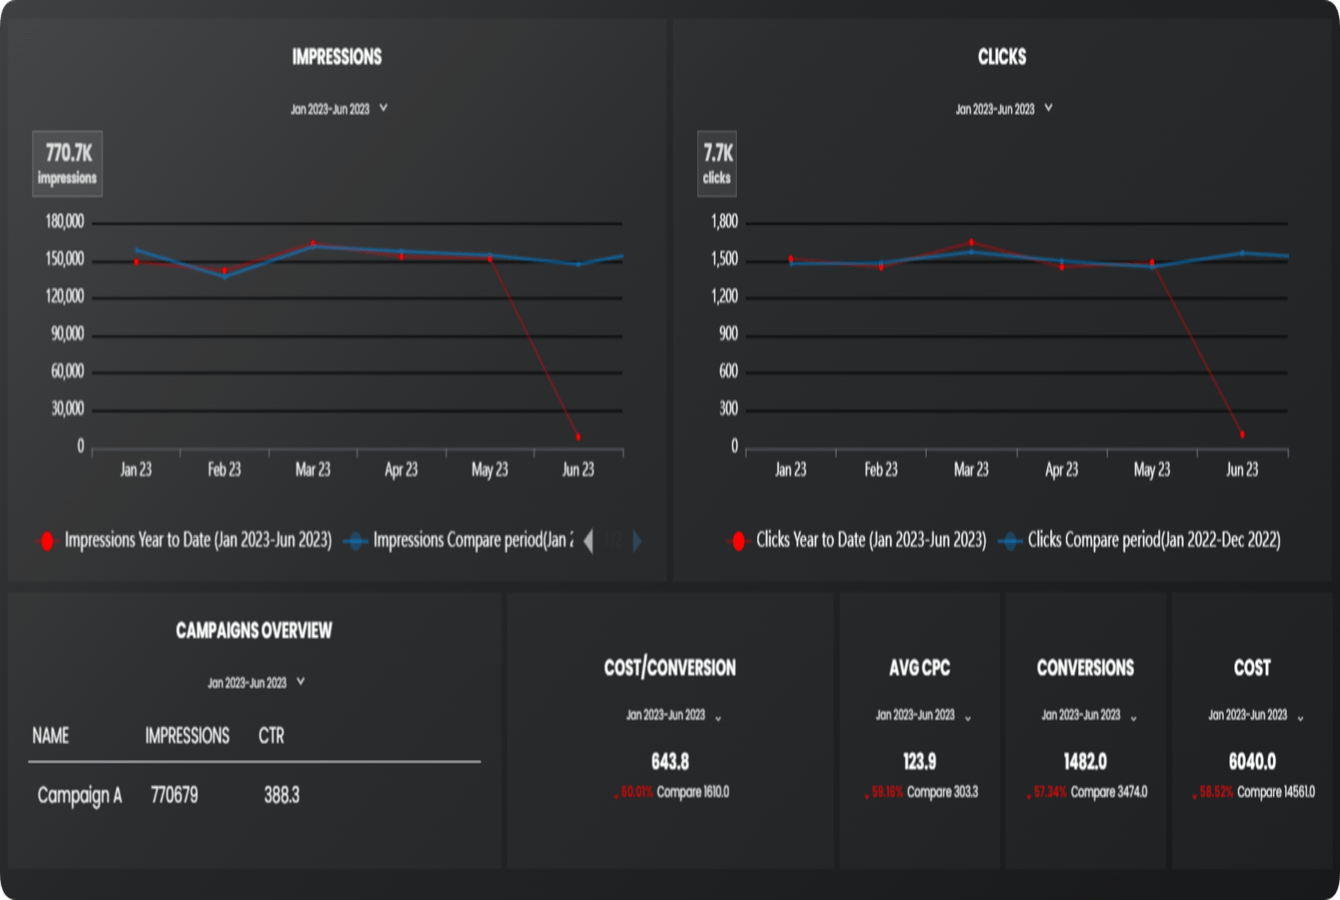
Google Ads dashboard template
Track the Google ad campaigns and important metrics like cost per conversion, impressions, conversion rate, etc. with a customizable, efficient and simple Google ads dashboard template. Enhance your campaign performance by analyzing the data.
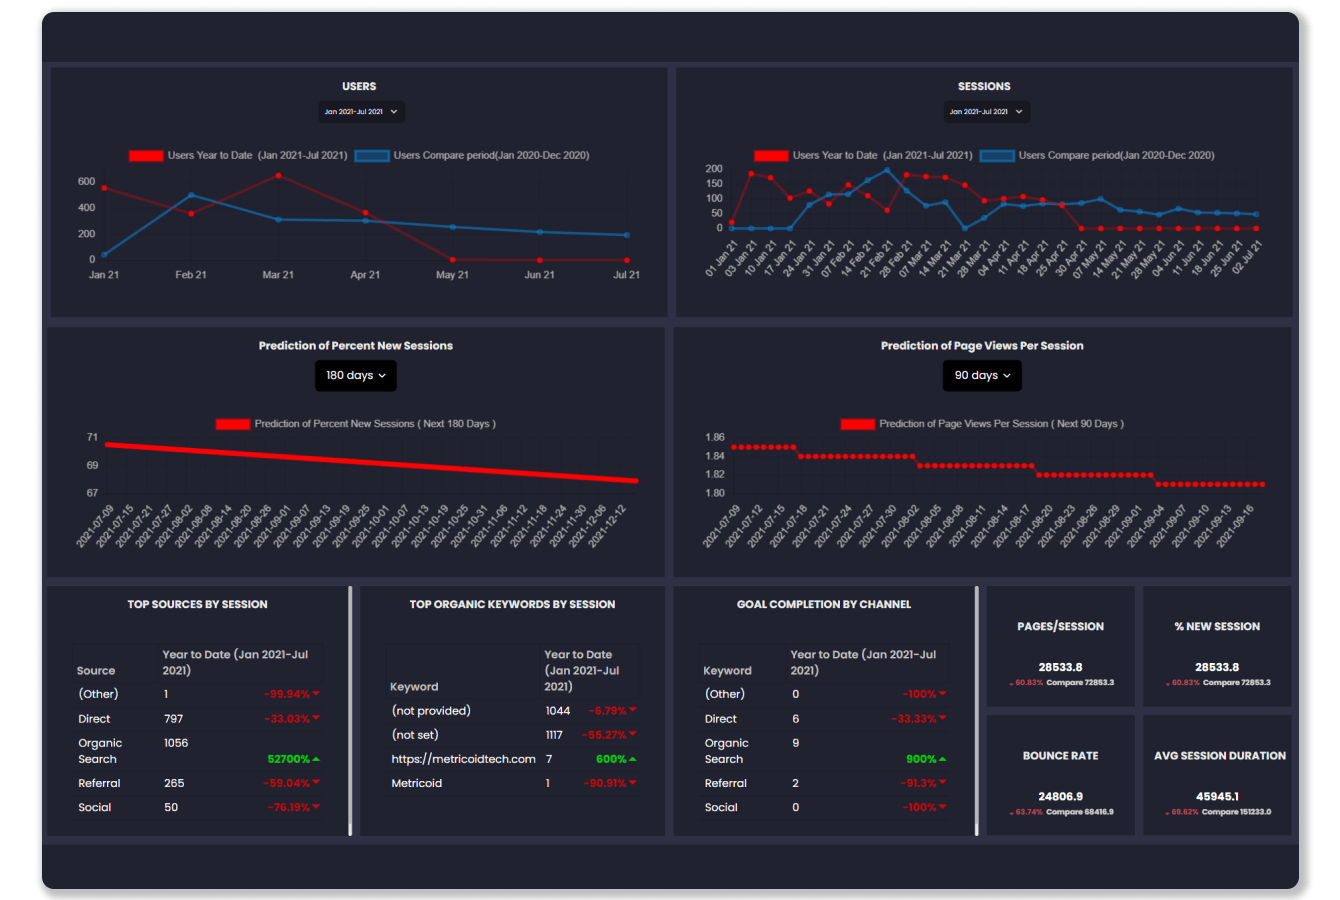
Google Analytics (Website traffic)
Google Analytics dashboard template which will give you insights about your users, sessions, referrals and more.
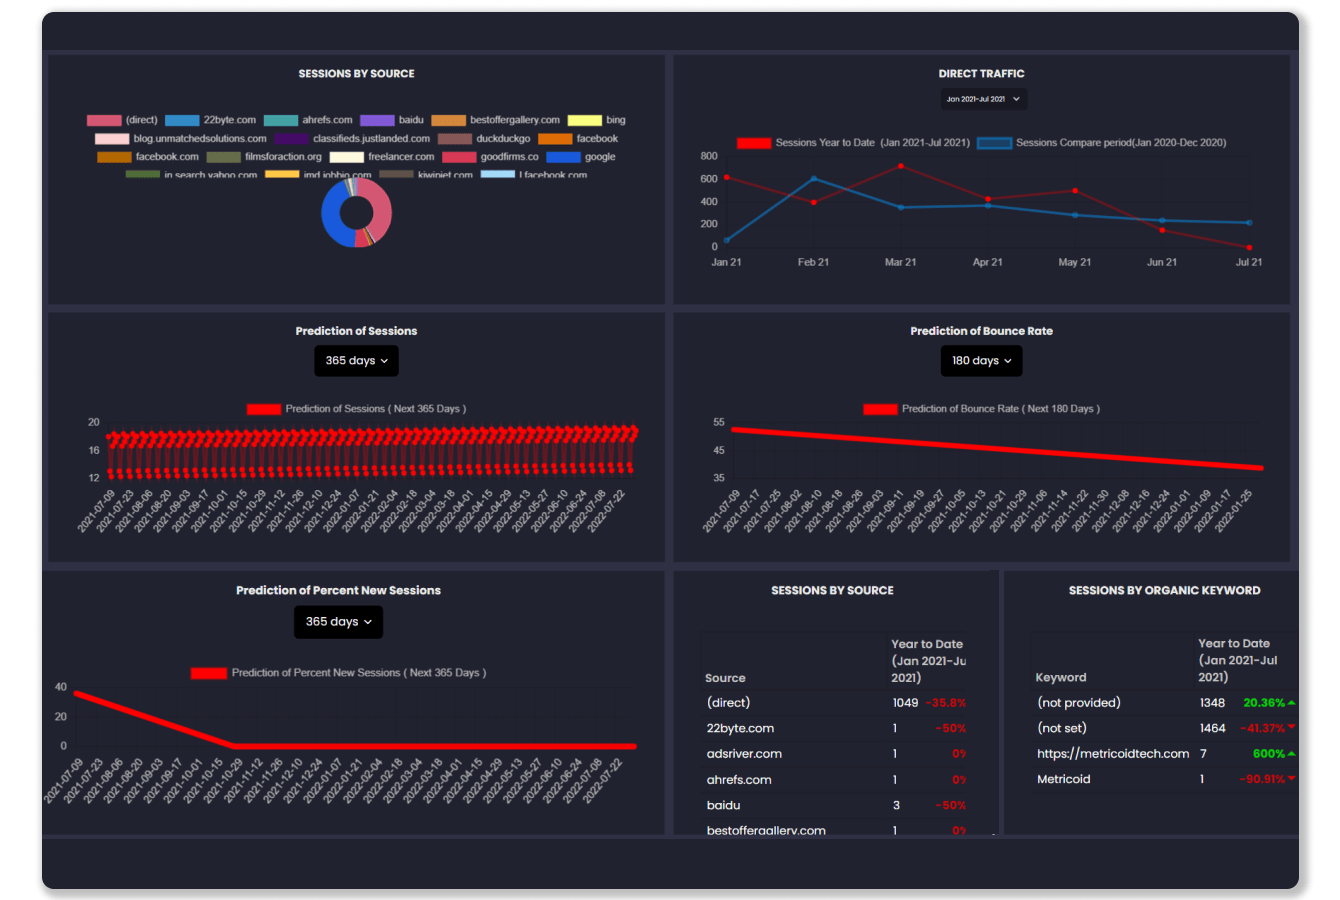
Google Analytics (Acquisition Snapshot)
Google Analytics dashboard template which will give you insights about your users, sessions, referrals and more.
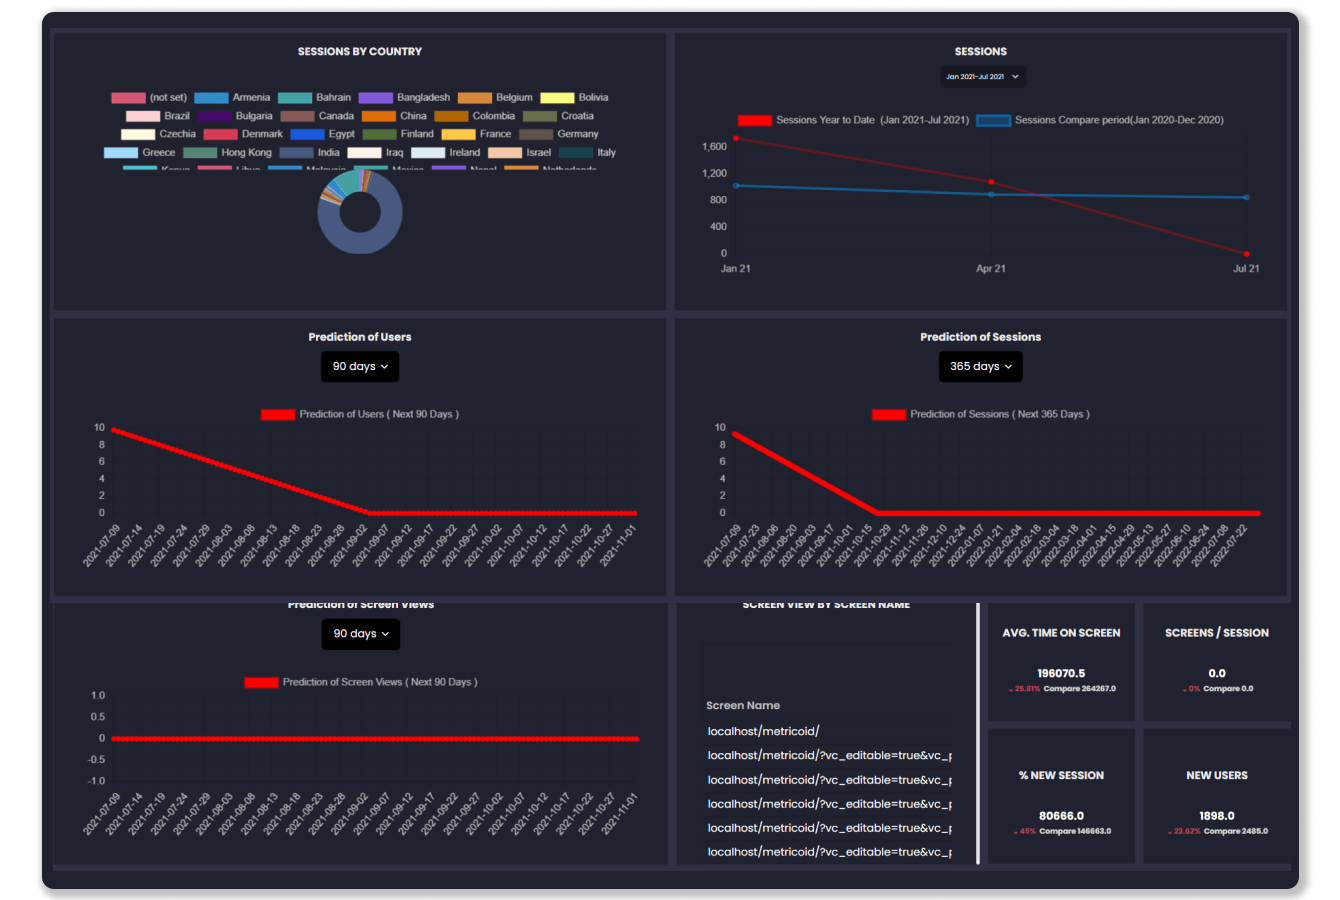
Google Analytics (Mobile app metrics)
Use this free mobile app metrics dashboard template to easily measure user retention and engagement,and more.
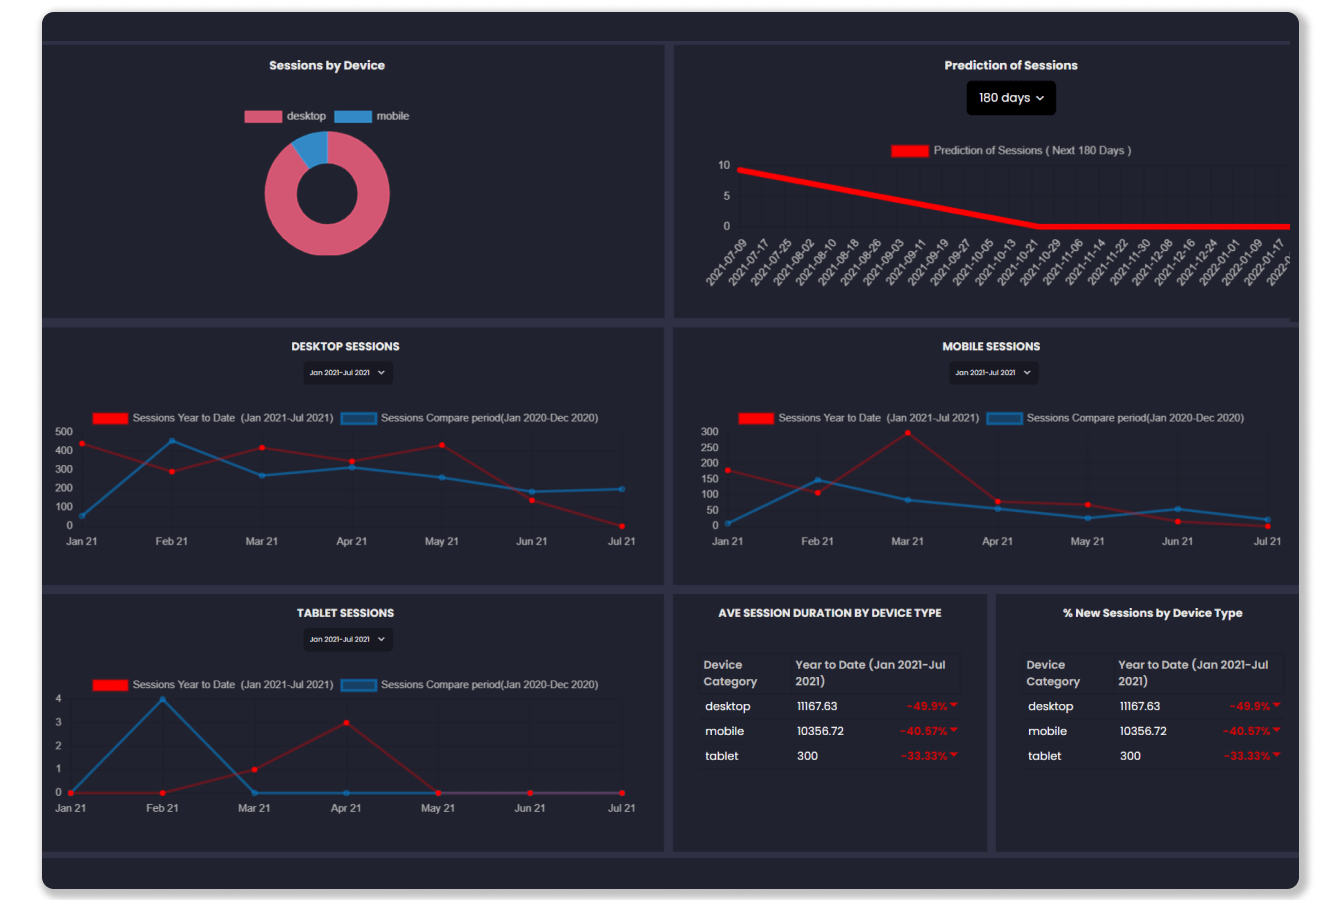
Mobile vs Desktop Traffic
Use this free dashboard template to optimize your website’s user experience for both mobile and desktop.
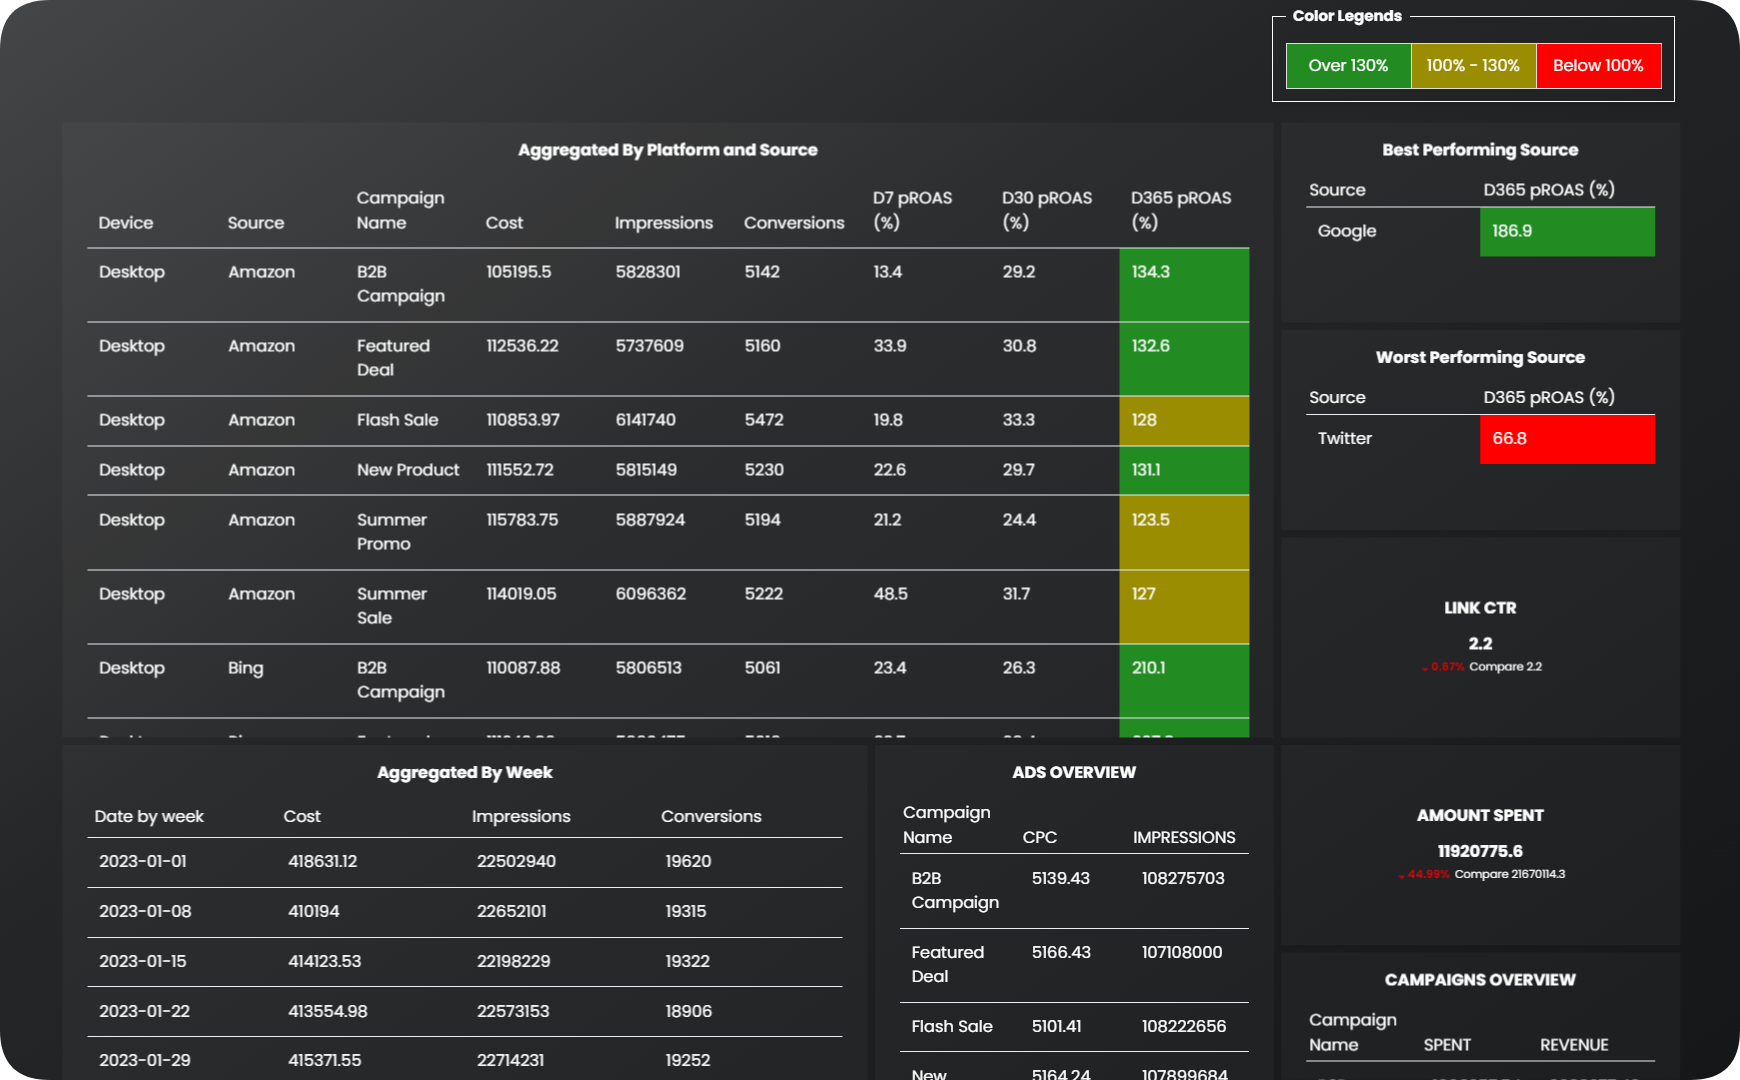
Campaign Management Dashboard Template
Optimize Campaign Success with Predictive ROAS , Your All-in-One Marketing Campaign Management Dashboard
