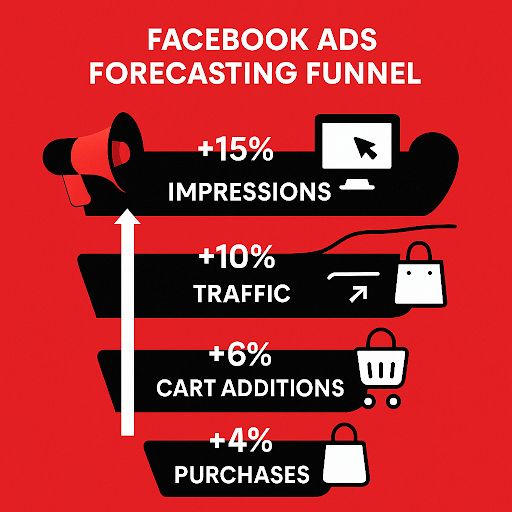
Facebook Ads Dashboard Table of Contents Scenario An e-commerce business runs Facebook ad campaigns targeting website traffic but wants to understand how traffic influences cart additions and ultimately purchases. Challenge The team struggles to predict the optimal balance between ad reach, traffic, and downstream metrics like cart additions and purchases. Solution with Japio Forecasting Feature: 1. Forecasting Relationships: Forecast future website traffic based on ad impressions and CTR trends.Model the relationship between traffic and cart additions, as well as between cart additions and completed purchases.Show diminishing returns on website traffic once cart addition rates hit a plateau. 2. Insights for Marketing Teams: Increasing reach by 15% is predicted to result in a 10% increase in website traffic.This drives a 6% increase in cart additions and a 4% increase in purchases. 3. Actions Taken: Focus budget on ads with high CTR and retargeting audiences most likely to complete purchases.Use dynamic ads to increase conversion rates in the final purchase stage. Result Cart additions increased by 20%.Purchase conversions increased by 12%.ROI on Facebook ads improved by 25%. How Teams Use It Marketing Team: Optimize campaign objectives for traffic vs. purchases.Purchase conversions increased by 12%.Data Science Team: Incorporate new cart abandonment metrics into forecasting models. Ready to unlock full-funnel clarity for your Facebook Ads? See how Japio helps you forecast traffic, conversions, and purchases—before you spend. 👉 Book Your Forecasting Demo Now