Data Science for Marketing Analytics

Table of Contents

Aim/Objective/Goal

The concern with this Dataset is that views and likes are our attributes of interest so they shouldn’t be loaded as row values. Instead, they must be displayed as columns names. As a result, we have addressed this issue below

Lets see how user had to use python coding for analyzing, cleaning, transforming & visualizing the data in one of the kaggle article 

https://www.kaggle.com/code/emmanueldjegou/data-science-for-marketing-analytics

				
					# Importing the library
import pandas as pd

# Storing the CSV file into DataFrame
df = pd.read_csv('/kaggle/input/sales-dataset/sales.csv')

# Importing the CSV file with specific criteria
df = pd.read_csv('/kaggle/input/sales-dataset/sales.csv', header = 1, nrows = 100,  usecols = [0,1,2])


					# Importing Pandas Library
import pandas as pd

# Storing the JSON file into DataFrame
user_info = pd.read_json('/kaggle/input/user-info/user_info.json')

# Checking whether the data is properly loaded
user_info.head()

Checking for Missing values
# Getting a summary of the data loaded into DataFrame
user_info.info()


Loading Unstructured Data

				
					# Importing the libarary pandas
import pandas as pd

# Loading the first data into DataFrame
campaign_data = pd.read_csv("/kaggle/input/campaign-dataset/data.csv")

# Displaying the first five rows
campaign_data.head()


					# Reloading the first data into DataFrame
campaign_data = pd.read_csv("/kaggle/input/campaign-dataset/data.csv", header = 1)

# Displaying the first five rows
campaign_data.head()


Checking for Missing values

				
					# Summary of the Data
campaign_data.info()


<class ‘pandas.core.frame.DataFrame’>

RangeIndex: 100 entries, 0 to 99

Data columns (total 2 columns):

 #   Column  Non-Null Count  Dtype

—  ——  ————–  —–

 0   views   100 non-null    int64

 1   likes   100 non-null    int64

dtypes: int64(2)

memory usage: 1.7 KB

Japio without coding

Now, let’s see below how we can achieve the Kaggle things in Japio without coding skills

Loading Data

To upload data into Japio from various sources like CSV files, Excel spreadsheets, and JSON files, you can follow these general steps:

Load Structured csv dataset

https://www.kaggle.com/code/emmanueldjegou/data-science-for-marketing-analytics/input?select=sales.csv 

Following steps demonstrate how to load data if you have  CSV file:

Step 1

After logging in to the Japio application at https://app.japio.com  , you will find the “Data Manager” option on the left side of the page . Click on the Data Manager to proceed .

Step 2

If you already have a connection on which you want to transform or visualize the data, click on “My Connections” at the top of the page. You will be able to see your existing connections there.

If you don’t have any existing connections, click on “+NEW CONNECTION” located in the top right corner of the page to create a new connection.

Step 3

https://app.japio.com/data-manager/data-source

After clicking on “+NEW CONNECTION” you will be presented with various data sources from which you can fetch your data into Japio. This will enable you to transform and work with your data within Japio’s platform.

Suppose you want to upload a csv file then hover over the CSV data source, and you will see a “+ connect” button as shown below.

Step 4

After clicking on “+ connect” a dialog box will appear

Step 5

After clicking on the “+connect” button, a dialog box will appear where you will be prompted to provide a name for the connection and upload your CSV file. This step allows you to establish the connection between Japio and the selected data source. By filling in the required fields and clicking the “Connect” button, you will initiate the process of importing the data from the CSV file into Japio. This will enable you to perform further analysis and manipulation of the data within Japio’s platform.

After successfully loading the data, you will be redirected to the data connection page in Japio, specifically to the URL: https://app.japio.com/data-manager/data-connections/data-connection/ connector-id. Here, you will be able to see the connection you loaded with the name you provided during the data connection setup. From this page, you can access and work with the loaded data for further analysis, transformation, visualization, or any other desired operations within Japio.

Load Unstructured csv dataset

  • We have to structure this csv file  before loading it to Japio .Delete  the first row and transform it into a two-column “Views and Likes” format.
  • Now follow the steps given in theLoad Structured csv dataset section.

Load Json Data

https://www.kaggle.com/code/emmanueldjegou/data-science-for-marketing-analytics/input?select=user_info.json 

  • Make sure that your data is saved in .json format
  • Go to Data Manager > Data Source 
  • Select json data source .

After this you can follow the next steps from  “Load Structured csv dataset section.

Access of loaded data

To access the data you have loaded into Japio and perform further operations, you can follow these steps:

  1. Click on ” Data Manager >My Connections” to view your connected data sources.

2. Search for the specific data source from which you have loaded your data such as CSV as Data Source.

3. Once you have located the data source, you will see a count or number associated with it, indicating the number of connections.

4. Once you have located the data source, you will see a count or number associated with it, indicating the number of connections.

5. After clicking on the  number of connections, you will be able to see all your connections and access your active connections. From there, choose the specific connection on which you want to transform the data . Click on the “+” symbol. This will allow you to proceed with the data transformation process.

6. After clicking on the “+” symbol, you will be redirected to a page with a URL like “https://builder.japio.com/public/datasetbuilder-view/”  followed by a connection ID. This page allows you to transform your data. Select the required fields and click on “Get Data” to proceed with the data transformation process.

Clean /Transform Data

  1. Access the page “https://builder.japio.com/public/datasetbuilder-view/”  followed by the connection ID by following the steps mentioned in the “Access of loaded data” section.
  2. On the page, locate and click on the “+ Add Transform” button, which is located on the left side of the page. This will open up the transformation options as shown below.
add transform

3. Choose the desired type of transformation rule based on your requirements. Here are some common types of transformation rules you can apply:

Check Null/missing Values

Following steps will explain how to check  Null values 

  1. Click on + Add Transform  > Filter Data

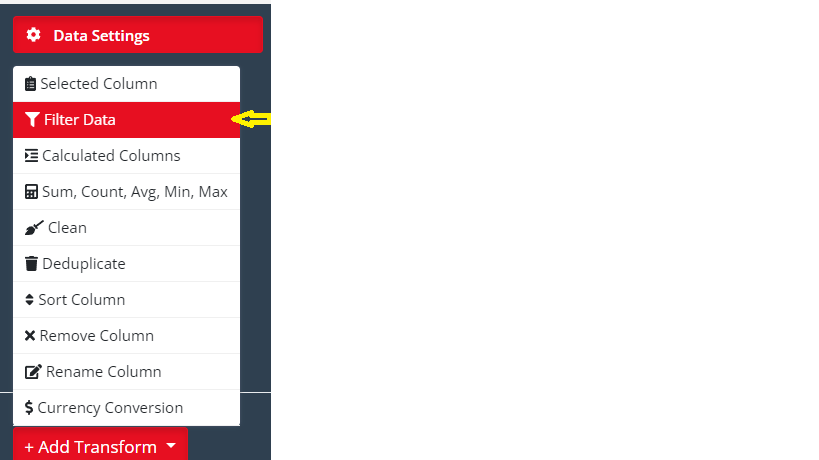
2. In the transformation panel, select the desired column from the “Column” dropdown. This is the column in which you want to see null values.

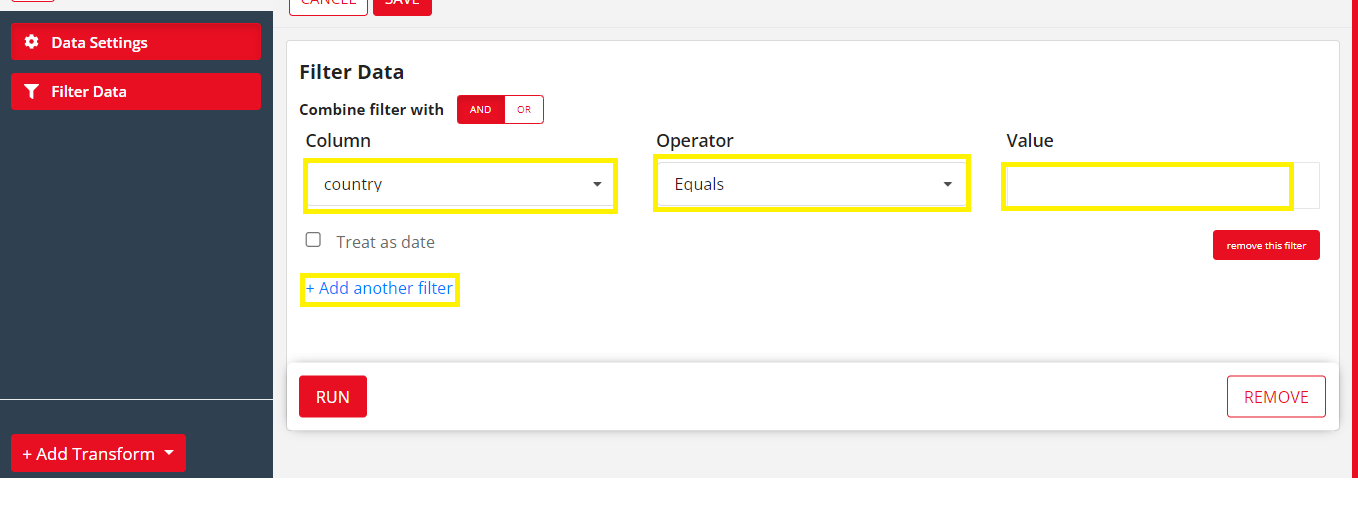
3. Choose the operator “Equal” from the operator field and  leave the value field blank.

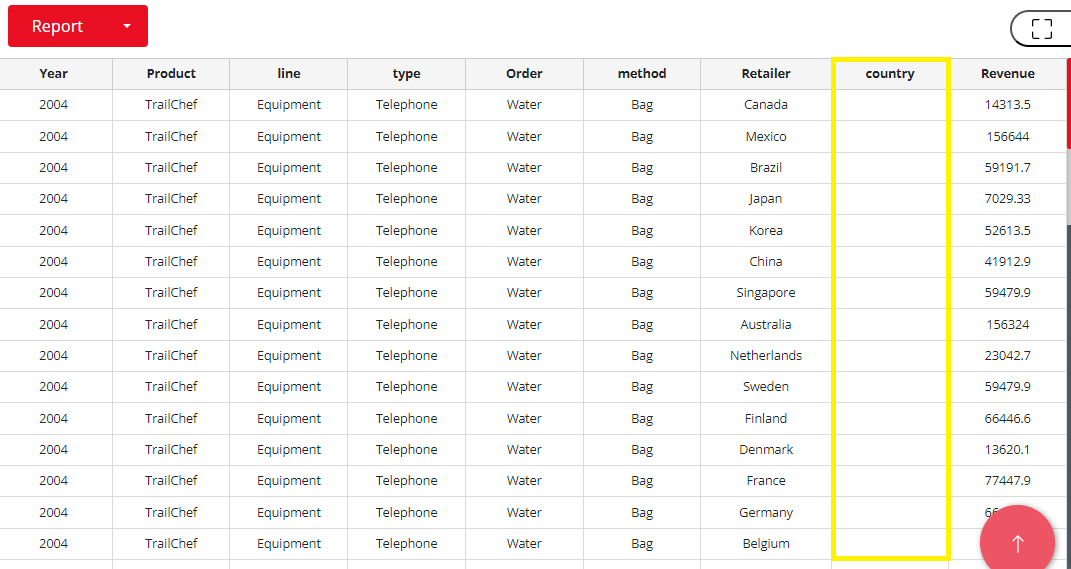
4. By clicking on the “Run” button, you will get the rows where the selected column has null values.


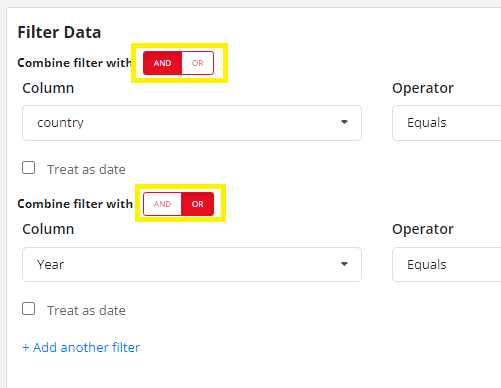
5. If you want to add additional filters, click on the “+ Add another filter“. This allows you to apply multiple filters to further refine your data based on different conditions.

“I selected the ‘country‘ column, set the operator as ‘Equal,’ and left the value field blank. After selecting these fields, I clicked on ‘Run,’ and as a result, I obtained all the rows with no value in the ‘country’ column.”

6.Repeat steps 2 and 3  for each additional filter you want to add. Select the desired column and operator for each filter.

7. If you are adding more than one filter, make sure to select the appropriate logical operator (AND / OR) based on your requirements.

 Select “AND” if you want to retrieve data only if all the selected filters are satisfied.

Select “OR” if you want to retrieve data if any one of the filters is satisfied.

8.After adding all the desired filters, click on the “Run” button to apply the filters and see the filtered data.

Remove some columns

To remove columns from your dataset, you can follow these steps

  • By using the “Selected Column” and “Remove Column” transformation rules, you can easily remove unwanted columns from your dataset.
By using Selected Column transformation rule

We will remove country column because it has high number of missing values , so that we can use this data for further analysis 

  • So lets remove country column by using Selected Column transformation rule 
  • Click on Selected Column  and select all column except  country

After clicking on the “RUN” button, the dataset will be processed based on the applied transformation rules, and the resulting dataset will no longer contain the “country” column

By using Remove Column transformation rule
  • So lets remove country column by using Remove Column  transformation rule 
  • Click on Remove column  and select country column 
  • You can select multiple columns which you want to remove from dataset 
  • After clicking on the “RUN” button, the dataset will be processed based on the applied transformation rules, and the resulting dataset will no longer contain the “country” column

Rename Column

After removing the Country column, we can see that the country information is now in the Retailer column, which is not according to the country name. Let’s change the column named Retailer to Country.

To rename column name  from your dataset, you can follow these steps

  1. select Rename Column transformation rule

2. Select the column you want to rename i,e Retailer.

3. Provide the new name for the column i,e Country.

4. Click on RUN, and you will see the data with the changed name from Retailer to Country, as shown below.

Save this data after adding transformation rules

To save the transformed data, follow these steps:

  1. Add all the desired transformation rules to the data as per your requirements.

2.At the top of the page, on the Japio Dataset Builder interface located at “https://builder.japio.com/public/datasetbuilder-view /” followed by the connector ID, you will find a field where you can enter a title for the dataset. Enter a title in this field to save the dataset with the specified title.

  1. Optionally, you can add a description for the dataset in the provided field (this step is optional but can be helpful for documentation purposes).
  2. Finally, click on the “Save” button to save the transformed data with the specified title and description.

By following these steps, you will be able to save the transformed data in Japio with a title and an optional description for future reference and usage.

Here i have taken sales transformed data as dataset title

To proceed after saving data instantly

After clicking on save, a dialog box will appear within 30-60 seconds.

Click on “Proceed” to navigate to the desired page. If you want to continue transforming your data on the Dataset Builder page, click on “Proceed” for “I want to transform data on the Dataset Builder page” Alternatively, if you want to visualize your data by adding a metric, click on “Proceed” for “I want to add a metric with this dataset”

Download the transformed data for further usages

After you analyzed the data and transformed it, you can now use it wherever you need. For example, you may need this to train a model, use a BI tool like PowerBI or use in Data warehouse. 

To download your transformed data follow the following steps 

  1. Log in to Japio if you haven’t already done so.
  2. Go to the Data Manager section, which is typically located in the sidebar or menu.
  3. Click on “My Datasets” to access your saved datasets. Here, you will see a list of your datasets with the titles you provided when saving the data.
  4. After locating your desired dataset in Japio’s Data Manager > My Datasets section, you should be able to see a download icon. By clicking on this icon you will be able to download the dataset in either JSON format or CSV format, depending on your selection.


Conclusion

As we see above how Japio can help Data Scientists, Marketers and others to analyze their data without coding.