Marketing Analytics: Forecasting

Table of Contents

Aim/Objective/Goal

The goal of this case study is to demonstrate how we can use Japio to transform the data and use it wherever needed, maybe the transformed data would be used to train a model or use in an external BI tool like PowerBI, Tableau. After transforming the data in Japio we can also visualize it in the form of various metrics and dashboards. This is all you can do without a coding skill using the Japio platform. In the below section we will compare one of the kaggle articles where user had to use coding skills (python) to analyze, clean & transform the data. In the later section we will demonstrate how you can achieve the same using Japio without any coding.  

Lets see how user had to use python coding for analyzing, cleaning, transforming & visualizing the data in one of the kaggle article 

https://www.kaggle.com/code/mustafacicek/marketing-analytics-forecasting 

				
					df = pd.read_csv("../input/online-retail-final/online_retail_final.csv")
display(df.head())


					fig, ax = plt.subplots(figsize = (12, 5), facecolor = "#e5e5e5")
ax.set_facecolor("#101820")

weekly_prices.plot(ax = ax).set_title("Weekly Revenue for United Kingdom")
ax.legend(facecolor = "#101820", labelcolor = "#e5e5e5")

sns.despine()
plt.show()


Daily Data

				
					daily_sales = pd.DataFrame(df.groupby("InvoiceDate").sum().resample("D").sum()["TotalPrice"])
daily_sales


Japio without coding

Now, let’s see below how we can achieve the Kaggle things in Japio without coding skills

Dataset

We have used this sample data for the demonstrations 

https://www.kaggle.com/datasets/mustafacicek/online-retail-final 

Data Analysis and Transformation

Loading Data

To upload data into Japio from various sources like CSV files, Excel spreadsheets, and JSON files, you can follow these general steps:

Following steps demonstrate how to load data if you have  CSV file:

Step 1

After logging in to the Japio application at https://app.japio.com  , you will find the “Data Manager” option on the left side of the page . Click on the Data Manager to proceed .

Step 2

If you already have a connection on which you want to transform or visualize the data, click on “My Connections” at the top of the page. You will be able to see your existing connections there.

If you don’t have any existing connections, click on “+NEW CONNECTION” located in the top right corner of the page to create a new connection.

Step 3

https://app.japio.com/data-manager/data-source

After clicking on “+NEW CONNECTION” you will be presented with various data sources from which you can fetch your data into Japio. This will enable you to transform and work with your data within Japio’s platform.

Suppose you want to upload a csv file then hover over the CSV data source, and you will see a “+ connect” button as shown below.

Step 4

After clicking on “+ connect” a dialog box will appear

Step 5

After clicking on the “+connect” button, a dialog box will appear where you will be prompted to provide a name for the connection and upload your CSV file. This step allows you to establish the connection between Japio and the selected data source. By filling in the required fields and clicking the “Connect” button, you will initiate the process of importing the data from the CSV file into Japio. This will enable you to perform further analysis and manipulation of the data within Japio’s platform.

After successfully loading the data, you will be redirected to the data connection page in Japio, specifically to the URL: https://app.japio.com/data-manager/data-connections/data-connection/ connector-id. Here, you will be able to see the connection you loaded with the name you provided during the data connection setup. From this page, you can access and work with the loaded data for further analysis, transformation, visualization, or any other desired operations within Japio.

Access of loaded data

To access the data you have loaded into Japio and perform further operations, you can follow these steps:

  1. Click on ” Data Manager >My Connections” to view your connected data sources.

2. Search for the specific data source from which you have loaded your data such as CSV as Data Source.

3. Once you have located the data source, you will see a count or number associated with it, indicating the number of connections.

4. Once you have located the data source, you will see a count or number associated with it, indicating the number of connections.

5. After clicking on the  number of connections, you will be able to see all your connections and access your active connections. From there, choose the specific connection on which you want to transform the data . Click on the “+” symbol. This will allow you to proceed with the data transformation process.

6. After clicking on the “+” symbol, you will be redirected to a page with a URL like “https://builder.japio.com/public/datasetbuilder-view/”  followed by a connection ID. This page allows you to transform your data. Select the required fields and click on “Get Data” to proceed with the data transformation process.

Download the transformed data for further usages

After you analyzed the data and transformed it, you can now use it wherever you need. For example, you may need this to train a model, use a BI tool like PowerBI or use in Data warehouse. 

To download your transformed data follow the following steps 

  1. Log in to Japio if you haven’t already done so.
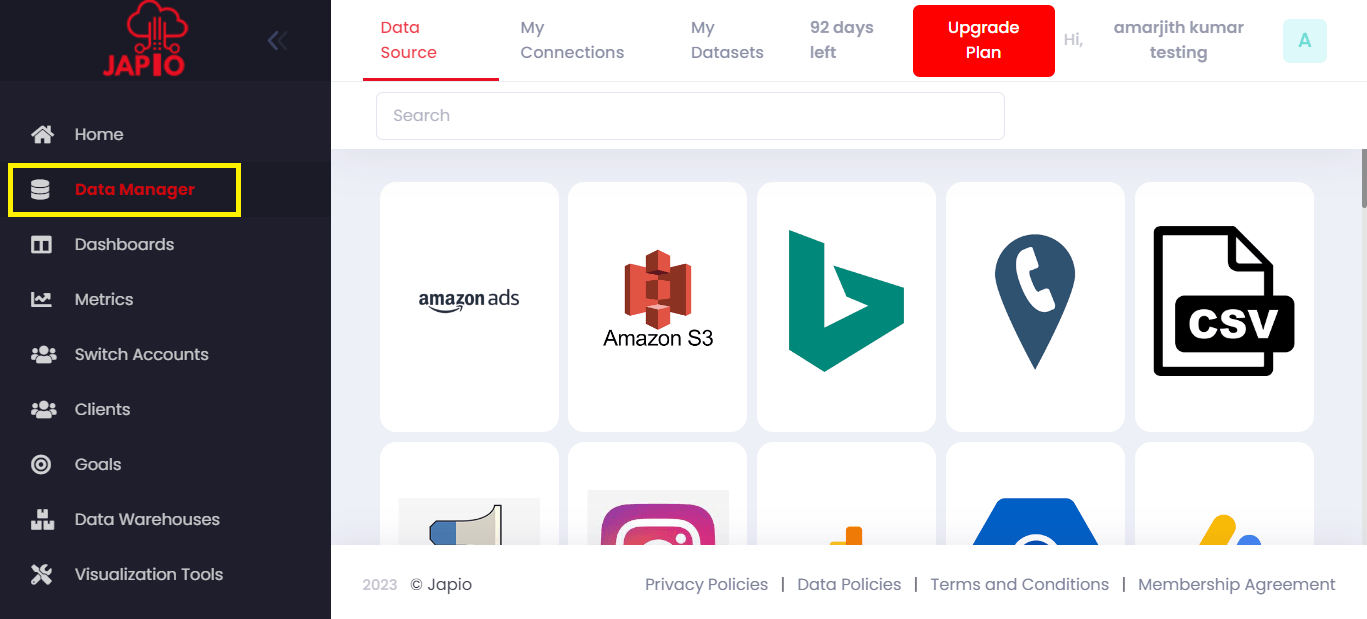
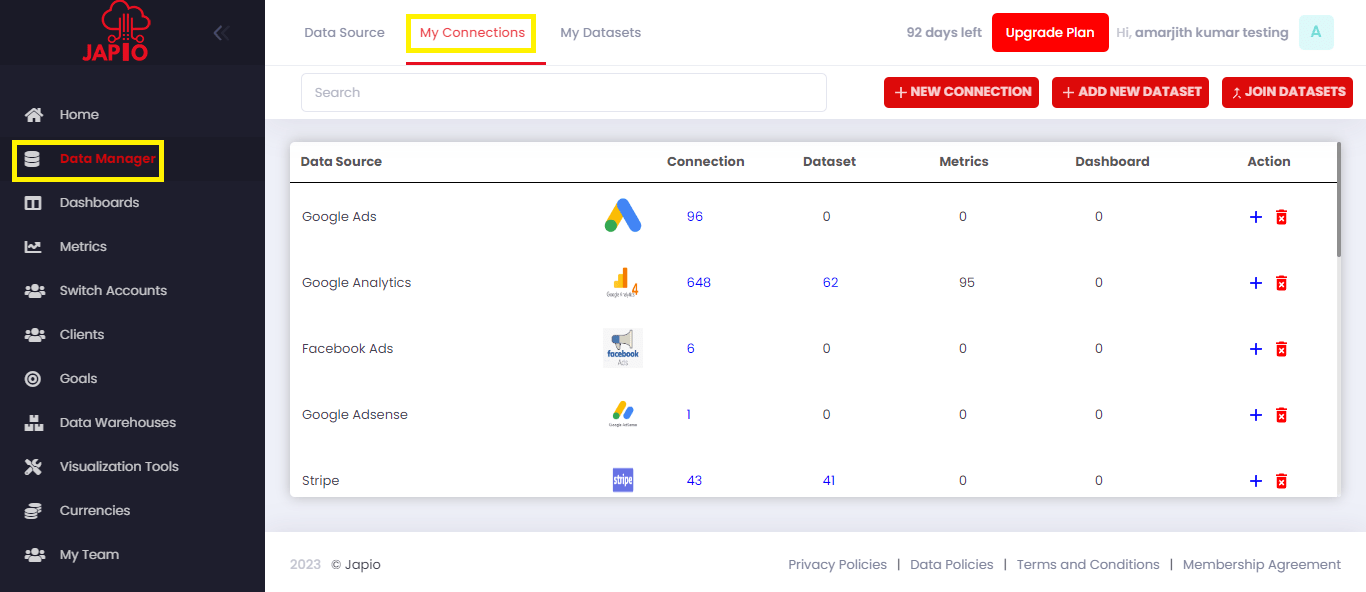
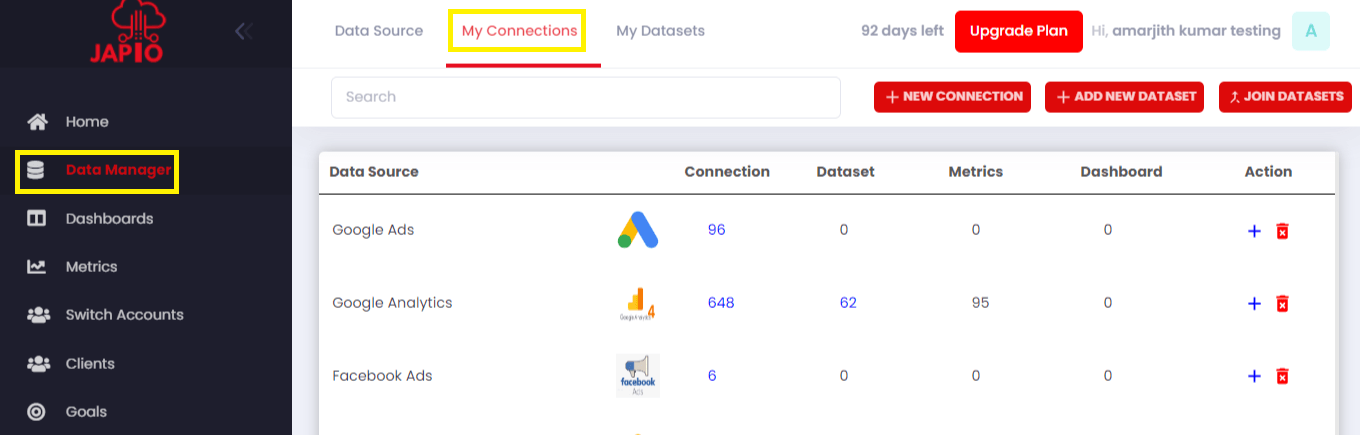
  2. Go to the Data Manager section, which is typically located in the sidebar or menu.
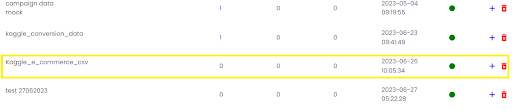
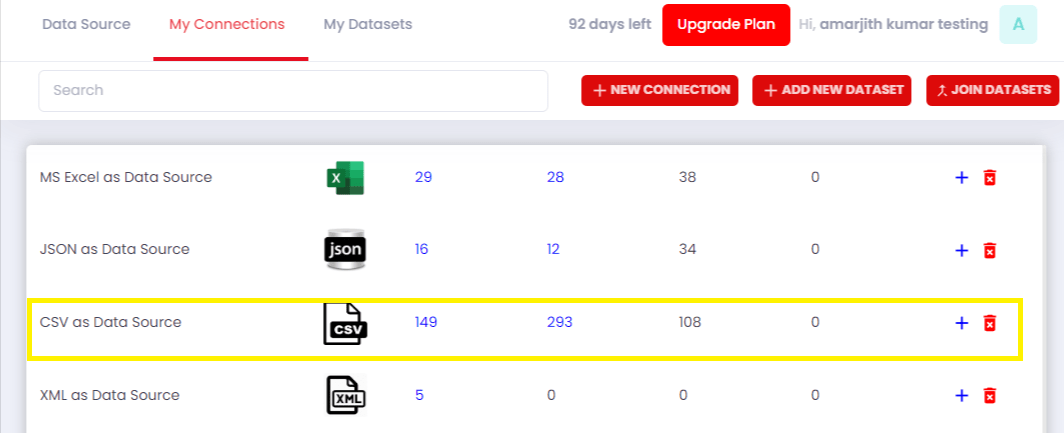
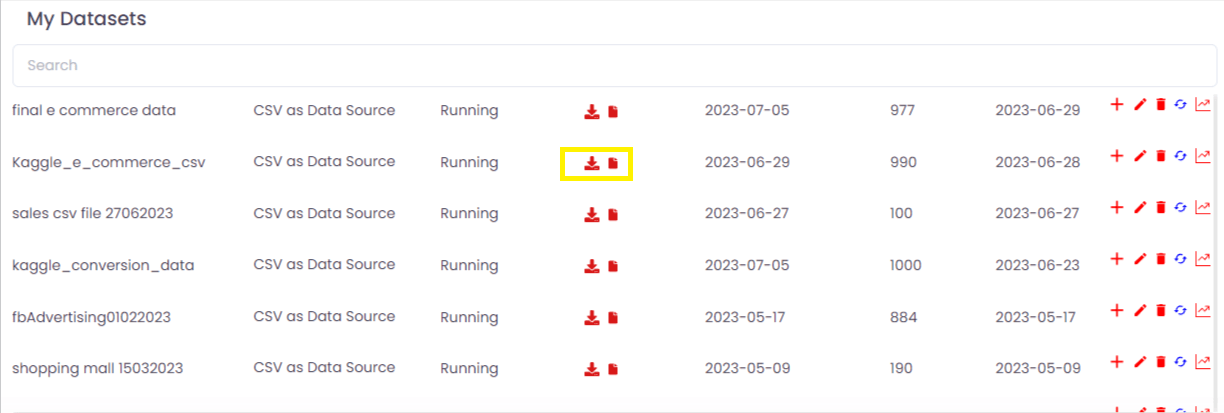
  3. Click on “My Datasets” to access your saved datasets. Here, you will see a list of your datasets with the titles you provided when saving the data.
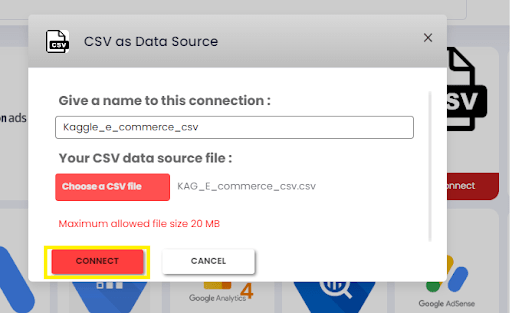
  4. After locating your desired dataset in Japio’s Data Manager > My Datasets section, you should be able to see a download icon. By clicking on this icon you will be able to download the dataset in either JSON format or CSV format, depending on your selection.


Data Visualization

To visualize your data, navigate to the page https://builder.japio.com/public/metricbuilder/  followed by the dataset ID. You can reach this page by following the instructions in the “How to use saved transformed dataset” section or by clicking on the “Proceed” button next to “I want to add a metric with this dataset” as discussed in the  “To proceed after saving data instantly” section. Once you’re on this page, you can add metrics to analyze your data. Below are the metrics that have been added:

Weekly analysis of Total Price

  1. Click on the Chart type to select line chart

2. After clicking on the “Chart Type” , a modal will appear displaying all the available chart types. From there, you can select the “LINE” option. 

3. After this select the required field as shown below.

4. After selecting these required fields you will get the following metric

The above metric shows weekly transactions for all countries. However, if you want metrics for only specific countries, you can transform the data using the Filter transformation rule. You can refer to the “CRM Analytics > Data Analysis and Transformation” section to learn how to use transformation rules.

5. To save this metric refer to the CRM Analytics  > Save metrics” section . 

Daily analysis of TotalPrice

  1. After clicking on the “Chart Type” option, a modal will appear displaying all the available chart types. From there, you can select the “TABLE” option.

2. After this select the required field as shown below.

3. After selecting these required fields you will get the following metric

To save this metric refer to the CRM Analytics  > Save metrics” section . 

Conclusion

As we see above how Japio can help Data Scientists, Marketers and others to analyze their data without coding.