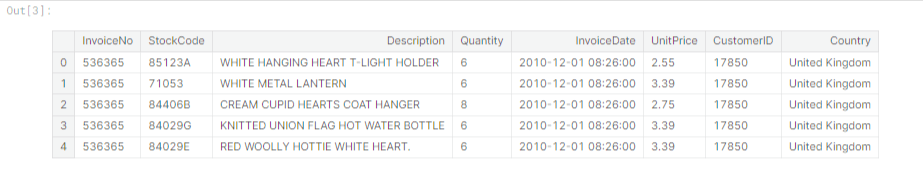
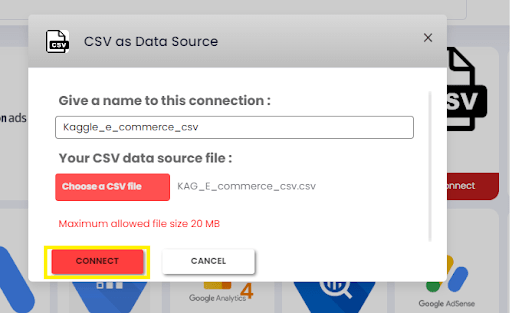
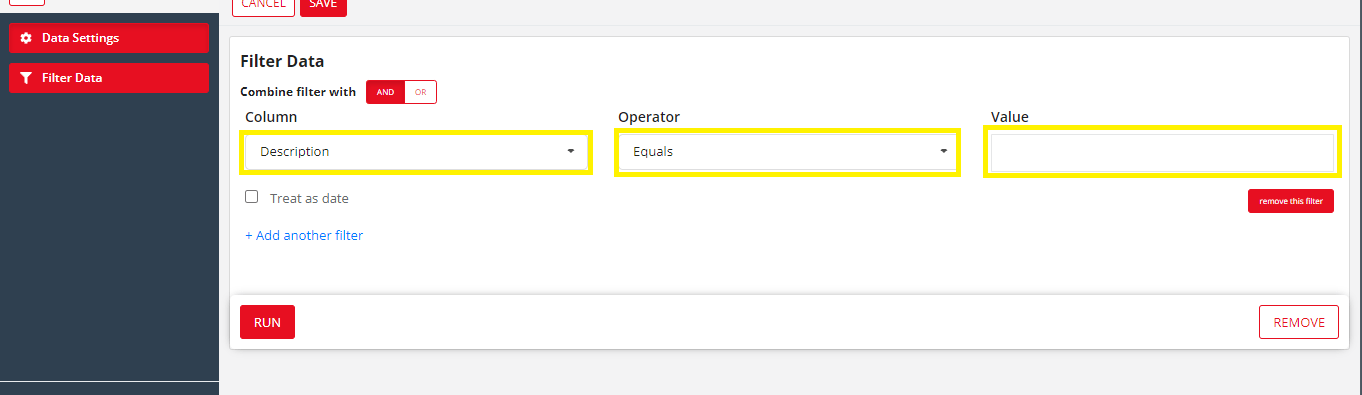
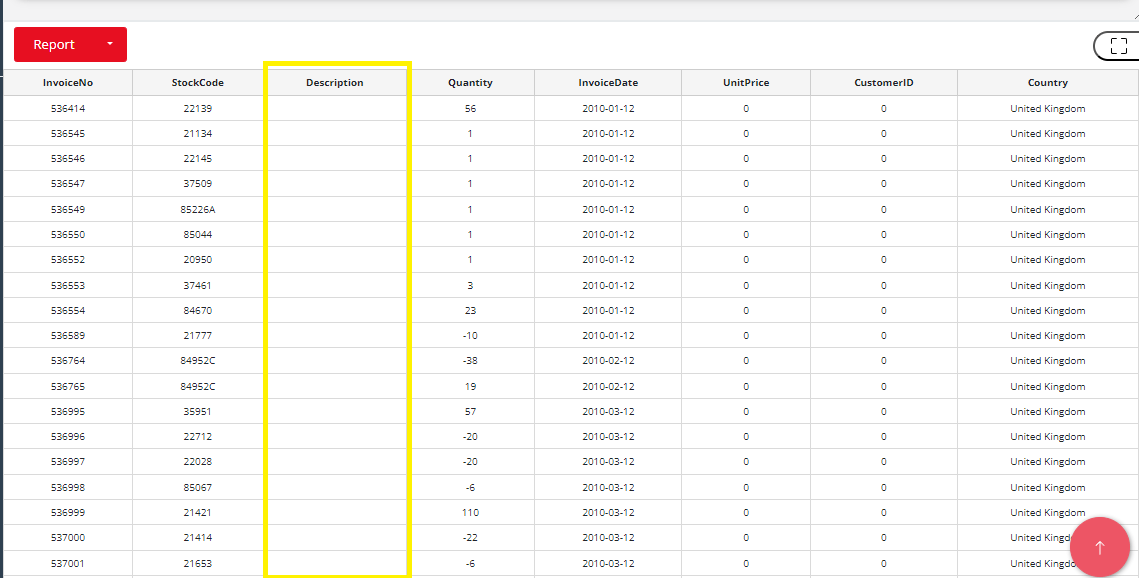
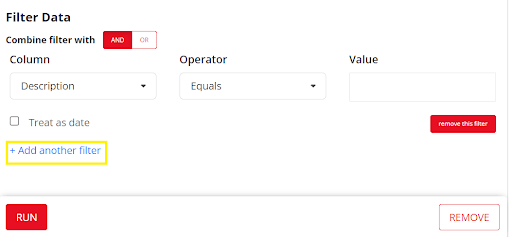
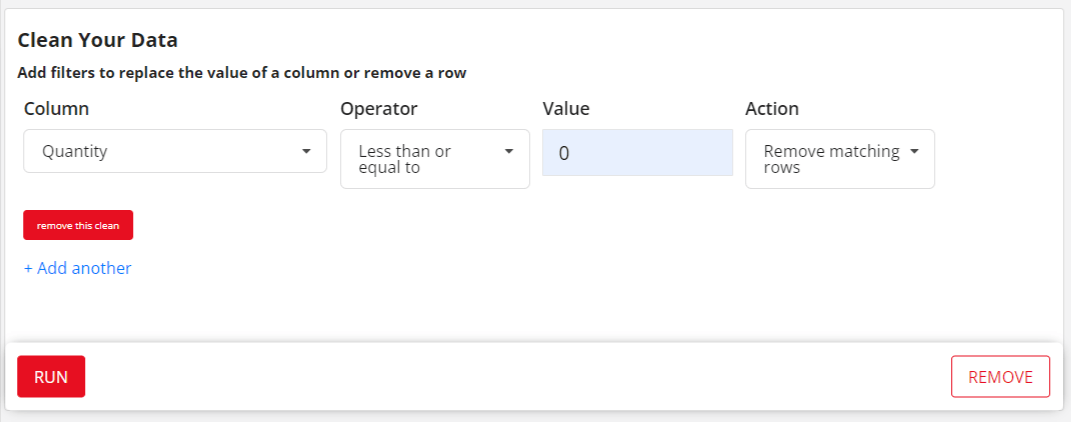
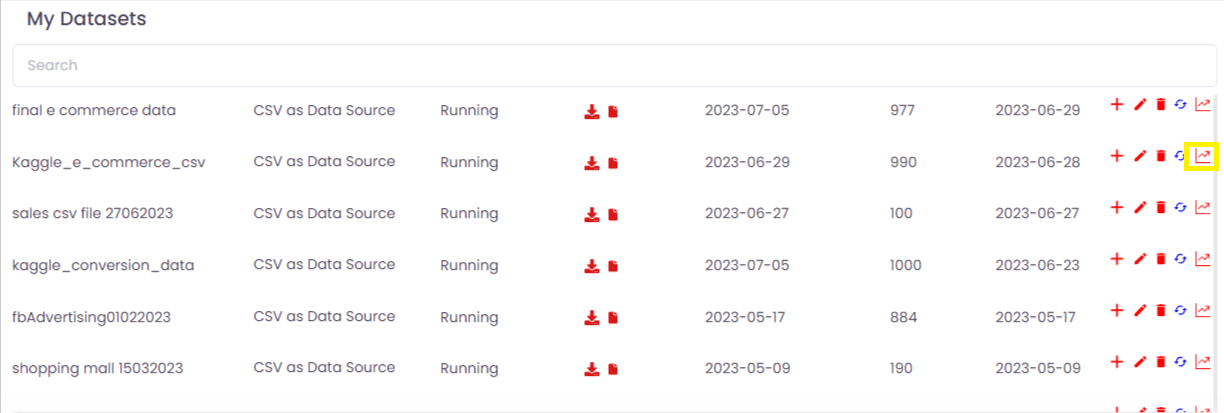
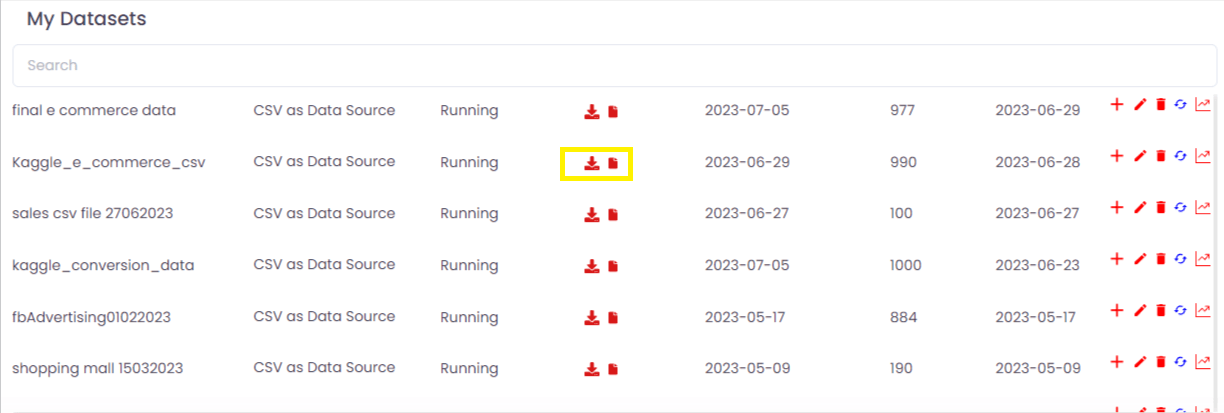
Ecommerce Store Analytics

Table of Contents

Aim/Objective/Goal

Typically e-commerce datasets are proprietary and consequently hard to find among publicly available data. However, The UCI Machine Learning Repository has made this dataset containing actual transactions from 2010 and 2011. The dataset is maintained on their site, where it can be found by the title “Online Retail”.

šŸ“Œ It is clearly seems that there are ouliters in Quantity and UnitPrice that have to be handled
šŸ“Œ There are negative values in UnitPrice and Quantity because ofĀ cancelled orders.
šŸ“Œ Missing values in Customer ID and Description.
šŸ“Œ Quantity and Unit Price should be multiplied in order to createĀ Total Price.

Lets see how user had to use python coding for analyzing, cleaning, transforming & visualizing the data in one of the kaggle articleĀ 

https://www.kaggle.com/code/sercanyesiloz/crm-analytics Ā 

				
					!pip install plotly
!pip install Lifetimes
!pip install nb_black
import os
import datetime
import squarify
import warnings
import pandas as pd 
import numpy as np
import datetime as dt
from operator import attrgetter
import seaborn as sns
import matplotlib.pyplot as plt
import matplotlib.colors as mcolors
import plotly.graph_objs as go
from plotly.offline import iplot
from sklearn.metrics import (silhouette_score,
                             calinski_harabasz_score,
                             davies_bouldin_score)
from lifetimes import BetaGeoFitter, GammaGammaFitter
from lifetimes.plotting import plot_period_transactions
%matplotlib inline
%load_ext nb_black
warnings.filterwarnings('ignore')
sns.set_style('whitegrid')
palette = 'Set2'


					ecommerce_path = '/kaggle/input/ecommerce-data/'

df = pd.read_csv(os.path.join(ecommerce_path, 'data.csv'),
                 header = 0,
                 encoding = 'unicode_escape',
                 dtype = {'CustomerID': str,
                          'InvoiceID': str},
                 parse_dates = ['InvoiceDate'], 
                 infer_datetime_format = True)
df.head()


Understanding Data

				
					def check_data(dataframe, head=5):
    print(" MISSING VALUES ".center(70,'-'))
    print(dataframe.isnull().sum())
    print(" DUPLICATED VALUES ".center(70,'-'))
    print(dataframe.duplicated().sum())
       
check_data(df)


————————— MISSING VALUES —————————

InvoiceNo Ā  Ā  Ā  Ā  Ā  0

StockCode Ā  Ā  Ā  Ā  Ā  0

DescriptionĀ  Ā  Ā  1454

QuantityĀ  Ā  Ā  Ā  Ā  Ā  0

InvoiceDate Ā  Ā  Ā  Ā  0

UnitPrice Ā  Ā  Ā  Ā  Ā  0

CustomerID Ā  Ā  135080

Country Ā  Ā  Ā  Ā  Ā  Ā  0

dtype: int64

————————- DUPLICATED VALUES ————————–

5268

Data Visualization

Number of Orders by Countries

				
					world_map = df[['CustomerID', 'InvoiceNo', 'Country']
              ].groupby(['CustomerID', 'InvoiceNo', 'Country']
                       ).count().reset_index(drop = False)
countries = world_map['Country'].value_counts()
data = dict(type='choropleth',
            locations = countries.index,
            locationmode = 'country names',
            z = countries,
            text = countries.index,
            colorbar = {'title':'Orders'},
            colorscale='Viridis',
            reversescale = False)

layout = dict(title={'text': "Number of Orders by Countries",
                     'y':0.9,
                     'x':0.5,
                     'xanchor': 'center',
                     'yanchor': 'top'},
              geo = dict(resolution = 50,
                         showocean = True,
                         oceancolor = "LightBlue",
                         showland = True,
                         landcolor = "whitesmoke",
                         showframe = True),
             template = 'plotly_white',
             height = 600,
             width = 1000)

choromap = go.Figure(data = [data], layout = layout)
iplot(choromap, validate = False)


Japio without coding

Now, let’s see below how we can achieve the Kaggle things in Japio without coding skills

Dataset

We have used this sample data for the demonstrationsĀ 

https://www.kaggle.com/code/sercanyesiloz/crm-analytics/input?select=data.csv

Data Analysis and Transformation

Loading Data

To upload data into Japio from various sources like CSV files, Excel spreadsheets, and JSON files, you can follow these general steps:

Following steps demonstrate how to load data if you haveĀ  CSV file:

Step 1

After logging in to the Japio application at https://app.japio.comĀ  , you will find the ā€œData Managerā€ option on the left side of the page . Click on the Data Manager to proceed .

Step 2

If you already have a connection on which you want to transform or visualize the data, click on “My Connections” at the top of the page. You will be able to see your existing connections there.

If you don’t have any existing connections, click on “+NEW CONNECTION” located in the top right corner of the page to create a new connection.

Step 3

https://app.japio.com/data-manager/data-source

After clicking on “+NEW CONNECTION” you will be presented with various data sources from which you can fetch your data into Japio. This will enable you to transform and work with your data within Japio’s platform.

Suppose you want to upload a csv file then hover over the CSV data source, and you will see a “+ connect” button as shown below.

Step 4

After clicking on “+ connect” a dialog box will appear

Step 5

After clicking on the “+connect” button, a dialog box will appear where you will be prompted to provide a name for the connection and upload your CSV file. This step allows you to establish the connection between Japio and the selected data source. By filling in the required fields and clicking the “Connect” button, you will initiate the process of importing the data from the CSV file into Japio. This will enable you to perform further analysis and manipulation of the data within Japio’s platform.

After successfully loading the data, you will be redirected to the data connection page in Japio, specifically to the URL: https://app.japio.com/data-manager/data-connections/data-connection/ connector-id. Here, you will be able to see the connection you loaded with the name you provided during the data connection setup. From this page, you can access and work with the loaded data for further analysis, transformation, visualization, or any other desired operations within Japio.

Access of loaded data

To access the data you have loaded into Japio and perform further operations, you can follow these steps:

  1. Click on ” Data Manager >My Connections” to view your connected data sources.

2. Search for the specific data source from which you have loaded your data such as CSV as Data Source.

3. Once you have located the data source, you will see a count or number associated with it, indicating the number of connections.

4. Once you have located the data source, you will see a count or number associated with it, indicating the number of connections.

5. After clicking on theĀ  number of connections, you will be able to see all your connections and access your active connections. From there, choose the specific connection on which you want to transform the data . Click on the “+” symbol. This will allow you to proceed with the data transformation process.

6. After clicking on the “+” symbol, you will be redirected to a page with a URL like “https://builder.japio.com/public/datasetbuilder-view/”Ā  followed by a connection ID. This page allows you to transform your data. Select the required fields and click on “Get Data” to proceed with the data transformation process.

Clean /Transform Data

  1. Access the page “https://builder.japio.com/public/datasetbuilder-view/”Ā  followed by the connection ID by following the steps mentioned in the ā€œAccess of loaded dataā€ section.

2. On the page, locate and click on the “+ Add Transform” button, which is located on the left side of the page. This will open up the transformation options as shown below.

add transform
3. Choose the desired type of transformation rule based on your requirements. Here are some common types of transformation rules you can apply:
Check Null Values :
  1. Following steps will explain how to checkĀ  Null valuesĀ 

    Click on + Add TransformĀ  > Filter Data

2.In the transformation panel, select the desired column from the “Column” dropdown. This is the column in which you want to see null/emptyĀ  values.

3. Choose the operator “Equal” from the operator field and leave the value field blank.

4.Ā  By clicking on the “Run” button, you will get the rows where the selected column has null values.
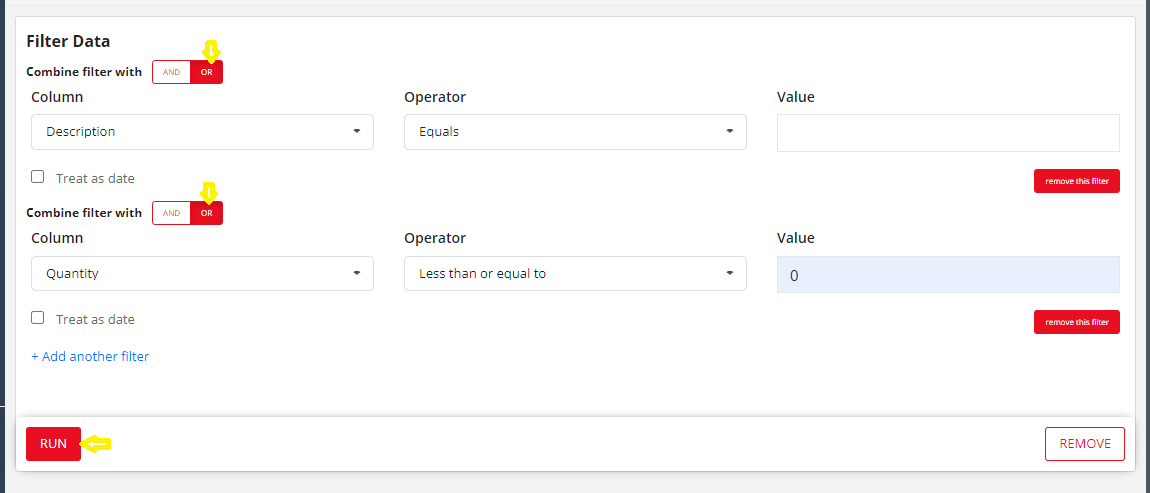
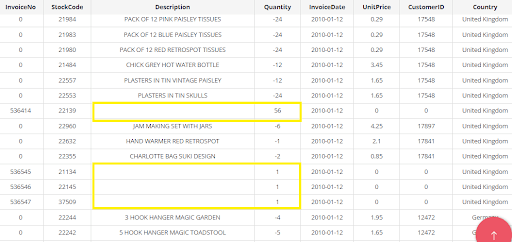
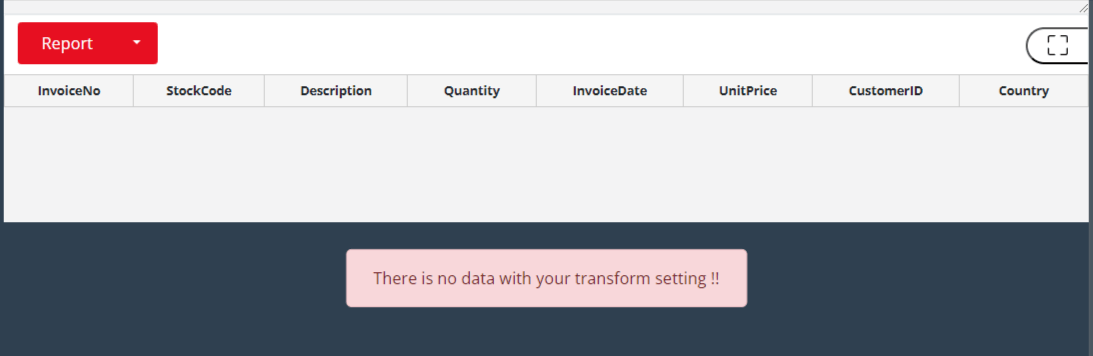
Ā  Ā  “I selected the ā€œDescriptionā€ column, set the operator as ‘Equal,’ and left the value field blank. After selecting these fields, I clicked on ‘Run,’ and as a result, I obtained all the rows with missingĀ  value in the Description column as shown below.ā€

5. If you want to add additional filters, click on the “+ Add another filter“. This allows you to apply multiple filters to further refine your data based on different conditions.

6. Repeat steps 2 and 3 for each additional filter you want to add. Select the desired column and operator for each filter. After adding as many filters as you want, click on RUN to get the desired results..

7. If you are adding more than one filter, make sure to select the appropriate logical operator (AND / OR) based on your requirements.

  • Select “AND” if you want to retrieve data only if all the selected filters are satisfied.

This filter transformation will retrieve data if the Description column is empty and the Quantity column has a value less than or equal to 0. Both conditions need to be satisfied for the data to be included.

  • Select “OR” if you want to retrieve data if any one of the filters is satisfied.

This filter transformation will retrieve data if either the Description column is empty or the Quantity column has a value less than or equal to 0. Either of these conditions needs to be satisfied for the data to be included.

Replace Or Remove

We have analyzed above that the Quantity column has many values which are less than 0, which is creating noise in the dataset because Quantity should be greater than or equal to zero. To get effective insights , we should remove these rows that have a value less than 0 in the Quantity column. For this purpose, we will use the Clean transformation rule


CleanĀ  transformation rule provides options to replace values with desired replacements or remove rows based on specific conditions such as matching a particular value or being blank/null. This allows you to clean and preprocess the data according to your requirements.

1 .Ā Ā Click onĀ  + Add Transform > Clean.

2. Choose the column name from which you want to remove or replaceĀ  some values.

3. After clicking on the RUN button you will be able to remove those rows

4. To verify if the rows with a Quantity less than or equal to 0 have been removed, you can use the Filter transformation rule. Select the Quantity column in the column field, choose the “Less than or equal to” operator in the operator field, and enter 0 in the value field. This will filter the data and show only the rows where the Quantity is less than or equal to 0, allowing you to confirm that the undesired rows have been removed.

The above result indicates that the rows with a value less than 0 in the Quantity column have been successfully removed.

Remove Duplicate rows

To remove duplicate rows click on Deduplicate transformation ruleĀ 

After clicking on the RUN button, you will obtain the data with duplicate values removed.

Calculate price

We can calculate price by multiplying Quantity and unit price .To achieve this purpose we will use Calculated Columns by clicking on +Add TransformĀ 

After clicking on run button we will get one additional column named Total Price in the dataset

Save this data after adding transformation rules

To save the transformed data, follow these steps:

  1. Add all the desired transformation rules to the data as per your requirements.

2.At the top of the page, on the Japio Dataset Builder interface located at “https://builder.japio.com/public/datasetbuilder-view /” followed by the connector ID, you will find a field where you can enter a title for the dataset. Enter a title in this field to save the dataset with the specified title.

  1. Optionally, you can add a description for the dataset in the provided field (this step is optional but can be helpful for documentation purposes).
  2. Finally, click on the “Save” button to save the transformed data with the specified title and description.

By following these steps, you will be able to save the transformed data in Japio with a title and an optional description for future reference and usage.

Here i have taken e commerce transformed data as dataset title

How to use saved transformed dataset

There is two way to use saved transformed dataset

1. To proceed after saving data instantly
After clicking on save, a dialog box will appear within 30-60 seconds.

Click on “Proceed” to navigate to the desired page. If you want to continue transforming your data on the Dataset Builder page(ā€œhttps://builder.japio.com/public/datasetbuilder-view/ā€ followed by {connection id}/{dataset id} ), click on “Proceed” for “I want to transform data on the Dataset Builder page” Alternatively, if you want to visualize your data by adding a metric page ( https://builder.japio.com/public/metricbuilder/{dataset id} ), click on “Proceed” for “I want to add a metric with this dataset”

2. If you Already have saved dataset
  • Go to Data Manager > My Datasets Ā  Ā you will all your saved dataset hereĀ 
  • If you want to add more transformation rules then Click on Edit iconĀ  .
  • If you want to visualize your data by adding various metrics then click on the metric arrow icon .

Download the transformed data for further usages

After you analyzed the data and transformed it, you can now use it wherever you need. For example, you may need this to train a model, use a BI tool like PowerBI or use in Data warehouse.Ā 

To download your transformed data follow the following stepsĀ 

  1. Log in to Japio if you haven’t already done so.
  2. Go to the Data Manager section, which is typically located in the sidebar or menu.
  3. Click on “My Datasets” to access your saved datasets. Here, you will see a list of your datasets with the titles you provided when saving the data.
  4. After locating your desired dataset in Japio’s Data Manager > My Datasets section, you should be able to see a download icon. By clicking on this icon you will be able to download the dataset in either JSON format or CSV format, depending on your selection.

Data Visualization

To visualize your data, navigate to the page https://builder.japio.com/public/metricbuilder/Ā  followed by the dataset ID. You can reach this page by following the instructions in the “How to use saved transformed dataset” section or by clicking on the “Proceed” button next to “I want to add a metric with this dataset” as discussed in theĀ  “To proceed after saving data instantly” section. Once you’re on this page, you can add metrics to analyze your data. Below are the metrics that have been added:

Number of orders by country

  • Choose the chart type as “Pie” from the available options. This will create a column chart visualization.
  • Select count operatorĀ  and InvoiceNo as column in Data Series
  • Select Country column in Slice

By following these steps, you will be able to create a column chart that displays the number of orders based on different countries.

Transaction by every customer

If you wish, you can save this metric. Please refer to the “Save Metrics” section for instructions on how to save metrics in Japio

Save metrics

  1. After configuring the metric, you can save it by giving it a title. At the top of the page, you will see a field labeled “Click to add a title.” Click on that field and enter a title for the metric. This will allow you to save the metric with the specified title for future reference and use.

2. After clicking on the “Save” button, a dialog box will appear giving you two options to save your metrics. You can either choose to create a new dashboard specifically for these metrics or save them to an existing dashboard that you have already created

Create New Dashboard

After selecting the option to create a new dashboard, you can follow the steps below:

  1. After clicking on save button you will be redirected to theĀ  https://app.japio.com/dashboard/view/ followed by metric idĀ  pageĀ  where you can edit the metric or you can save more metrics thereĀ 

2.After clicking on the “Edit” button on the https://app.japio.com/dashboard/view/ {followed by the metric id}Ā  page, you can click on the “Untitled” label and provide a name for the dashboard.

3. Click on ApplyĀ 

Select Existing Dashboard

save metrics by choosing ā€œSelect Existing Dashboardā€Ā  and choose your dashboard name such as ā€œCRMĀ  metricsā€

After selecting your existing dashboard, click on the Save button, and you will find all the metrics of that selected dashboard, including the newly added metric.

Conclusion

As we see above how Japio can help Data Scientists, Marketers and others to analyze their data without coding.