- November 1, 2022
- Posted by: Francis Kanneh
- Category: blogs
Being able to explain your findings in a clear, concise, and understandable manner to others can be one of your biggest problems as a data analyst. It’s also a crucial aspect of your profession and the one that is most obvious. If you don’t do this well, the stakeholders you work with across your organization might not completely understand the important business insights you’ve found. Give them no reason to wonder what you are doing spending the day alone at your desk. You must present those findings in a manner that is simple to understand.
Two major hurdles
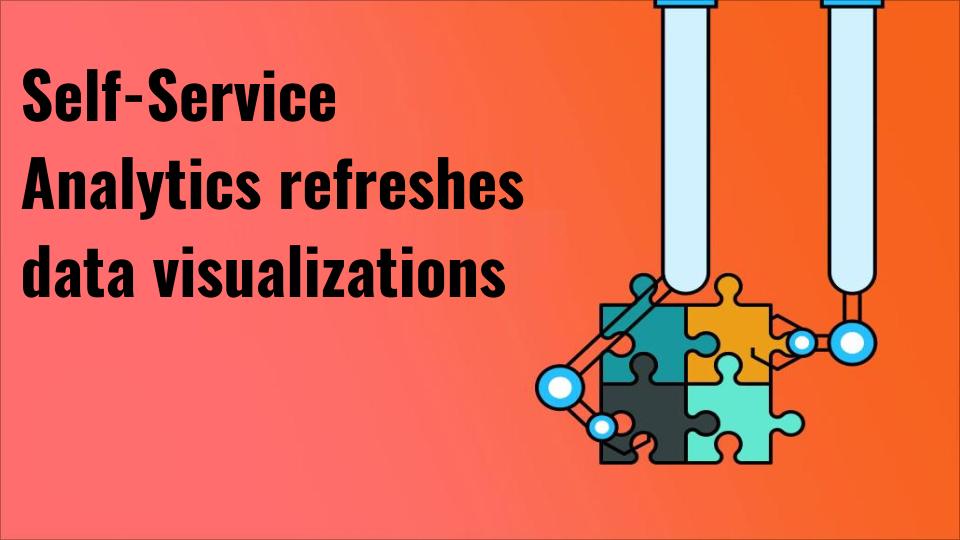
1. Prep and blend time leaves little for a thoughtful presentation.
50-75% of a data analyst’s time is spent preparing data for reports, dashboards, and visualizations. Good inputs are crucial. Great visualizations rely on rich, refined datasets. All that data prep leaves you little time to generate and perfect visualizations for stakeholders.
2. Without the flexibility of dashboards, you’re stuck copying and pasting data from static spreadsheets into charts.
Sometimes, you need to move quickly to get information ready for use in reports. How often have you wished you had a dynamic dashboard with drill-down capabilities when you were trapped in the office late at night doing a copy-paste or making PowerPoint charts based on static Excel numbers?
Visuals Improve data
Whatever data visualization platform you use, you presumably spend a lot of time preparing your data. That’s time you’d rather spend on requests or data.
Japio makes data preparation faster and easier and creates a richer, more powerful dataset. You want the visualizations that come out of your data to not only look good, but also be strong enough to handle both quick questions from executives and detailed questions from line-of-business managers.